Instructor Notes
This is a placeholder file. Please add content here.
Introduction to OpenRefine
Importing Data and Getting to Know the OpenRefine User Interface
Instructor Note
If you have a non-English-speaking audience, you can point out the option to change the language of the user interface. However, this is not advisable for the workshop itself, as the explanations were written for the English user interface and it could otherwise be very confusing for the instructor and the audience.
We will not be looking at extensions in this lesson, but they offer the possibility to customize OpenRefine in even greater detail and expand it with additional functions. Provide the link to the OpenRefine extensions page if participants are interested in additional functionality.
Instructor Note
The row/record distinction will be shown in the next chapter. For now, you can treat one row as one record.
Exploring Data
Instructor Note
If learners used the wrong separator or made a mistake during the
exercise, remind them that they can always return to a previous state
using the Undo/Redo tab. OpenRefine records every action,
making it safe to experiment and explore different approaches.
We will introduce this functionality in more detail in the last episode, but it is reassuring for learners to know that they can try things out without the risk of permanently damaging their project.
Instructor Note
There are often different ways to accomplish the same task in OpenRefine. In this case its also possible to create a text facet and then search for “blank”.
Custom Facets and GREL
Instructor Note
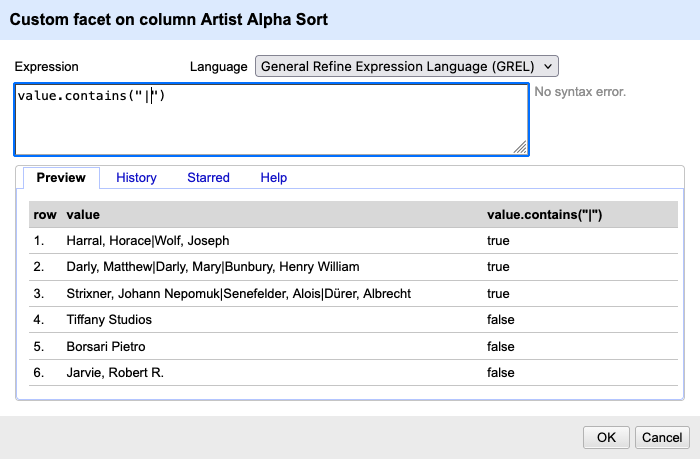
A new window appears. You see a text field where you can enter the
GREL function. At the bottom, there is a Preview section
where you can see the value (i.e. the value in the table) and, to the
right of that, the new value produced by the function. Under the
History tab, you can view the commands that have been used,
and under Help you find a detailed explanation.
Instructor Note
This challenge illustrates an important idea about custom facets. They do not have to group by the original cell content; they can group by computed values that you define using GREL.
Instructor Note
Go to the window and type value.split("|"). Show the
group that this creates an array with a varying number of elements. Then
add .length() to it and demonstrate that this now displays
the number of elements in the array.
Transforming Data
Instructor Note
Guide learners toward recognizing:
- nationality
- place names
- dates
- information on multiple artists
Emphasize that the column currently contains several different types
of information. In the documentation of the dataset it states that
Artist Display Bio contains information about “Nationality
and life dates of an artist, also includes birth and death city when
known”.
Instructor Note
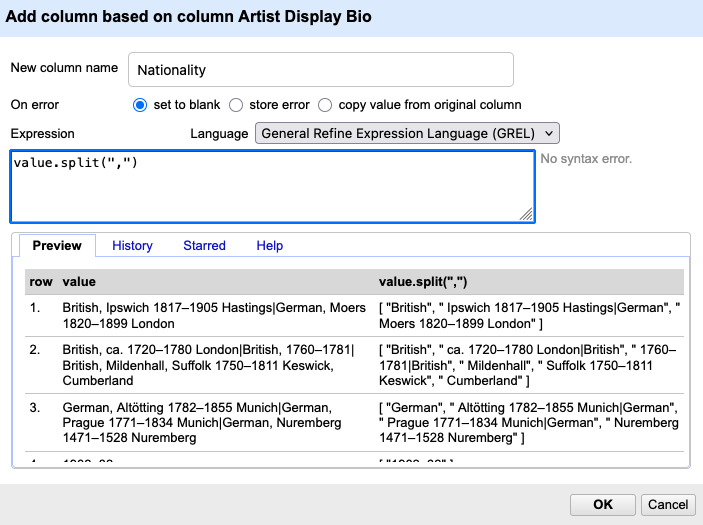
Describe the new window to the learners and remind them of the
similarities from window in the prevoius episode. On top you enter the
name of the new column. At the bottom, there is a Preview
section where you can see the value (i.e. the value in the table) and,
to the right of that, the new value produced by the function. Under the
History tab, you can view the commands that have been used,
and under Help you find a detailed explanation.
Instructor Note
If the learners are eager to try more transformation and depending on their depending on their familiarity with regular expressions and programming concepts you can give them the grel functions and let them describe them in their own words and push them to try them out.
if(value.contains(/[0-9]/), "", value)
value.replace(" (?)", "")
value.replace(/ \(born[^)]*\)/, "")
if(value.contains("active"), "", value)
value.trim()
Reconciling Data with External Data Sources
Instructor Note
Learners often assume that authority records provide a single “correct” answer. Emphasize that authority databases also contain ambiguity and that reconciliation always requires human judgement.