All in One View
Content from Introduction to OpenRefine
Last updated on 2026-06-24 | Edit this page
Overview
Questions
- What is OpenRefine and how can it help with messy data?
- What kinds of tasks and analyses can you perform with OpenRefine?
Objectives
- Identify typical problems in cultural heritage datasets
- Describe how OpenRefine supports exploratory data cleaning
Do you often work with digital data in your research, your studies or your work?
For example, cleaning it, processing it, converting it or analyzing it? Do you have an idea what problems could arise when working with data, especially external data?
Before you can answer research questions, you first need to understand and clean your data. In the humanities, you might work with lists of artworks, artists, historical events, or other information collected from museums, archives, or fieldwork. Often, this data is stored in spreadsheets or tables, and at first glance, it may seem tidy. But as you look closer, you may notice small issues: names spelled in different ways, missing details, or dates written in various formats. These challenges are common and can make it difficult to analyze or share your data.
OpenRefine is a free, open-source tool designed to help you work with messy data. Think of OpenRefine as a workbench for your data, a place where you can clean, organize, and explore information, even if you have no technical background. OpenRefine runs locally on your computer and opens in your web browser, providing a user-friendly interface that guides you through each step. Although OpenRefine runs in your web browser, nothing from your dataset is sent to the internet — everything runs locally on your computer.
Our Dataset
Throughout this lesson, you use a sample dataset from the Metropolitan Museum of Art (The Met) Open Access Initiative. The dataset includes artwork titles, creators, production dates, materials, and locations — fields that are typical for cultural heritage collections. Even if you have never worked with data before, you see how OpenRefine can make your research easier.
In many digital humanities projects, a significant amount of time is spent preparing and cleaning data before analysis. It’s not always the most exciting part, but it is essential. With OpenRefine, you learn how to think about data organization and develop practices for more effective data cleaning. By the end of this lesson, you will be able to clean, explore, and analyze structured cultural heritage data. You don’t need to be a technical expert, just curious and willing to try something new.
Spot the Messy Data
Look at the small sample below. It contains only a few records from
The Met dataset you work with later.
Identify anything that might cause problems during analysis.
| Title | Artist Display Name | Object Date | Object Name | City | Tags | Medium |
|---|---|---|---|---|---|---|
| Tile | J. and J. G. Low Art Tile Works | ca. 1884 | Tile | Chelsea | 0 | Earthenware |
| Cabrette | Joseph Bechonnet | 19th century | Cabrette | Effiat, Puy-de-Dôme | Animals | various material |
| “A weaver of dreams” | Margaret Neilson Armstrong; G.P. Putnam & Co., New York; Myrtle Reed | 1911 | New York | |||
| Design for a shawl with scrolling paisley leaves and Indian flowers | Fleury Chavant; Georges Schlatter; J.E.G.; Herault | [after 1844] | Book Print Ornament, Architectur | Paris | N/A | Lithograph |
| Nouveau Cayer de Paysages à l’usage des personnes qui apprennent le Dessin | J. B. Crépy | 1781 | Book | Paris, France | Etching, printed in red |
Questions to discuss:
- What inconsistencies or formatting issues can you spot?
- Which values might make filtering or sorting difficult?
- Are there entries where you would want to investigate further before
analysis?
- Why might these issues matter later in OpenRefine?
- Missing data are sometimes represented by blank cells, N/A or 0.
- Is the title the same as the object name? In some rows they differ in others they are the same.
- The
Artist Display Namecolumn sometimes contains more people. - Object dates are often not recorded as a specific year.
- The cities in the table could be ambiguous, is it Chelsea in the UK or Chelsea in the US? Additional information about the artist might help identify the correct location.
- Paris and Paris, France refer to the same place, but are recorded differently.
- Some titles are enclosed in quotation marks, while others are not.
Advantages of OpenRefine
With OpenRefine, you can import your data, discover patterns, fix mistakes, and transform your information so it’s ready for analysis or sharing. You don’t need to know how to code or use complicated software. OpenRefine is built for researchers who want to focus on their work, not on technical details.
One of the strengths of OpenRefine is its ability to help you explore your data and perform simple analysis right from the start. You can quickly filter and sort your data, group similar entries, and visualize distributions to spot trends or outliers. This makes it easy to get a sense of your dataset before diving deeper into research questions. You can also use built-in functions to split or merge columns, remove duplicates, and transform data formats, making your information more consistent and reliable.
OpenRefine supports a wide range of data formats, including CSV, Excel, and JSON, and can connect to online sources and databases. It also allows you to match your data against external databases, such as Wikidata, to enrich your dataset with additional information. Because OpenRefine is open source, it can be extended with add-ons and custom scripts, giving you even more possibilities. The active community around OpenRefine has developed many plugins that add new features, such as connecting to other data sources, exporting to different formats, or automating repetitive tasks.
- OpenRefine is a free, open-source tool for cleaning, organizing, and exploring messy data.
- You can easily import, filter, sort, and analyze your data, even without technical experience.
- OpenRefine supports many data formats and can be extended with add-ons and custom scripts for even more possibilities.
- Using OpenRefine helps you prepare your data for analysis, supporting transparent and reproducible research practices.
Content from Importing Data and Getting to Know the OpenRefine User Interface
Last updated on 2026-06-24 | Edit this page
Overview
Questions
- How do I start a new project in OpenRefine?
- How do I import a CSV file?
- What options and settings are available during import?
- How is the user interface structured?
Objectives
- Create and configure a new OpenRefine project
- Evaluate import settings using the preview pane and import a CSV file
- Identify the core interface components and explain their functions
Importing Data
In this episode, you import the Metropolitan Museum of Art dataset used throughout the lesson. To begin, open OpenRefine. When you start OpenRefine, a window in your web browser (at the address http://127.0.0.1:3333/) opens displaying the start page.
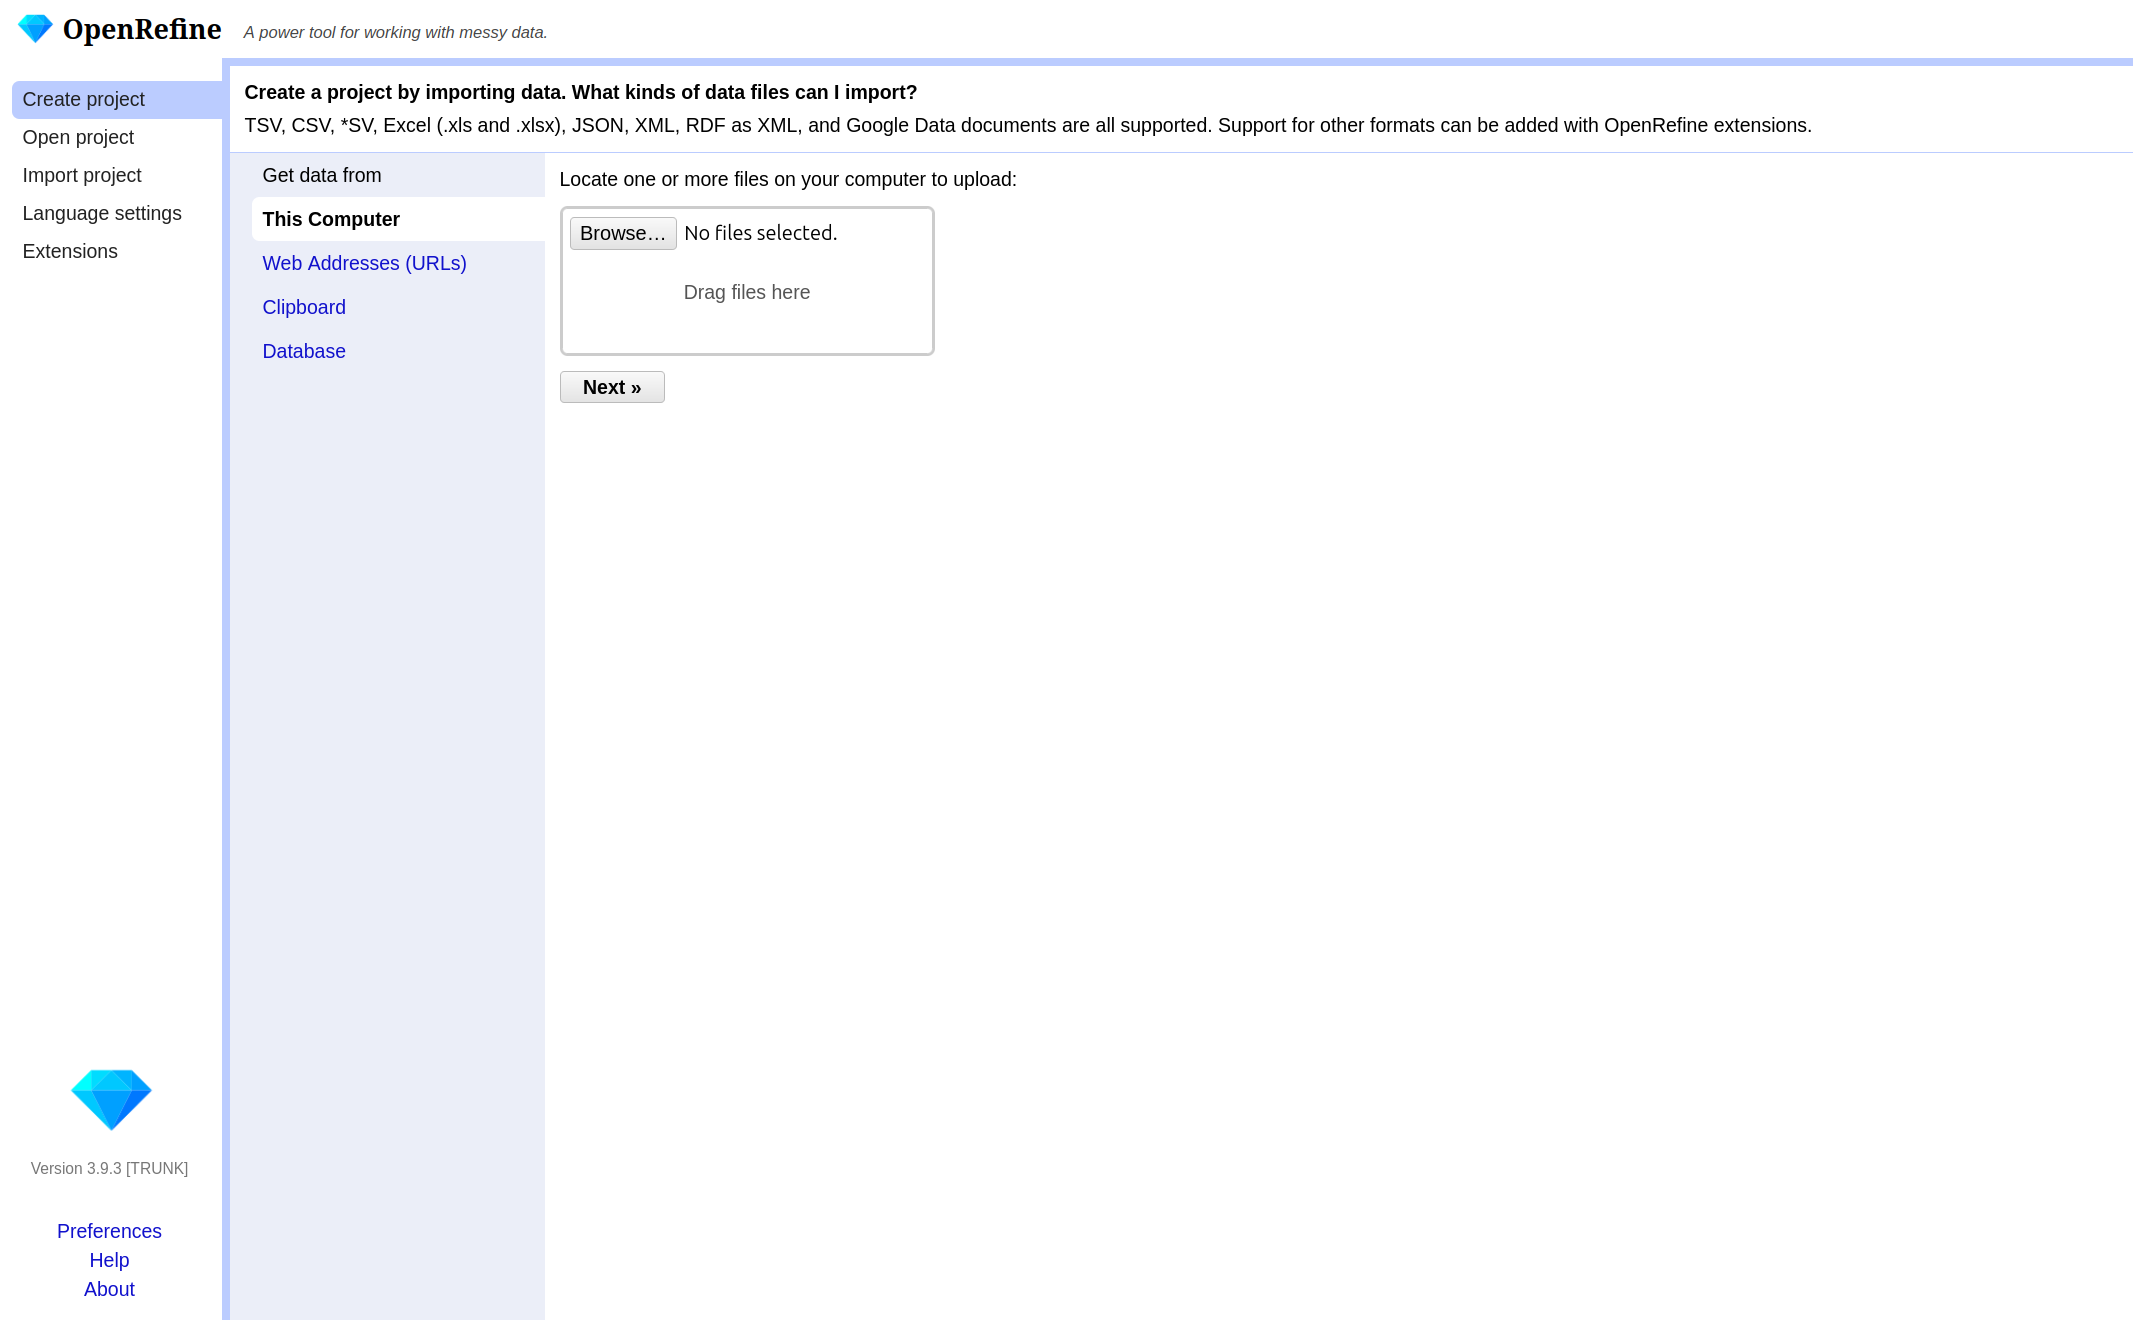
There are various options in the left-hand bar. You can:
- Create a new project and load data.
- Open an existing project.
- Import an existing project.
- Change the language of OpenRefine.
- Manage extensions.
OpenRefine structures your work in projects. To begin
working, you first need to create a new project and import The Met
dataset. If you pause your work on the project (the data and the changes
you made) and want to continue later on, you can choose
Open project. If a colleague sends you an OpenRefine
project, you can import it under Import project.
- Click on
Create Projectand then on Get data fromThis Computer. - Here click
Browse, locate the datasetmet_dataset_oa.csvon your computer and select it. - Click on
Nextand upload the data into OpenRefine. - On the next page OpenRefine shows you a preview of your data, allowing you to check that everything looks correct before you proceed.
Below the data preview, you find various import settings for how the data should be loaded. These settings have a direct effect on the preview above, allowing us to immediately check whether the settings are correct. This is especially important when files use non-standard formats, as incorrect settings may result in a distorted table structure.
What kinds of data files can I import?
There are several options for getting your dataset into OpenRefine. You can import files in a variety of formats including:
- Comma-separated values (CSV) or text-separated values (TSV)
- Text files
- JSON (javascript object notation)
- XML (extensible markup language)
- RDF (resource description framework)
- OpenDocument spreadsheet (ODS) or Excel spreadsheet (XLS or XLSX)
If needed, you can change the format on the left side under Parse data as. For more information see the Create a project by importing data page in the OpenRefine manual.
Import as Interpretation
Let’s test how sensitive the import process is to incorrect settings. Try changing the separator and the character encoding.
In the import preview, change the column separator from comma to
semicolon and the character encoding to US-ASCII and
UTF-8. Observe the preview carefully.
- How does the table structure change?
- How many columns are displayed now?
- Why does this happen?
- Regarding the character encoding, what difference can be identified?
- What would happen if you created the project without correcting this setting?
- The table structure collapses.
- Most or all values appear in a single column.
- This happens because the dataset is comma-separated. When the separator does not match the file structure, OpenRefine cannot divide the data into columns correctly.
- With the character encodiung
US-ASCIIumlauts, accents and dashes are not displayed correctly. In contrast everything looks fine usingUTF-8. - The dataset would be imported incorrectly, making further analysis difficult or impossible.
Sometimes, data files include extra header lines or notes at the top. You can tell OpenRefine to skip these lines, so only the actual data is imported. For Excel files, you can select which sheet to import. For CSVs, you can preview and adjust how columns are interpreted. There are many different options depending on the file format and the dataset. In our case, the default settings are sufficient.
Why import settings matter?
Import settings determine how OpenRefine interprets your file and turns it into a table. If these settings are incorrect, data may be split into the wrong columns, rows may be skipped, or values may be read incorrectly. Correct settings help prevent problems later in your workflow and save time.
- Once you are happy with the preview and settings, you can change
your project name above the preview and click
Create Project. - OpenRefine loads your data into its workspace on the next page.
Overview of the OpenRefine interface
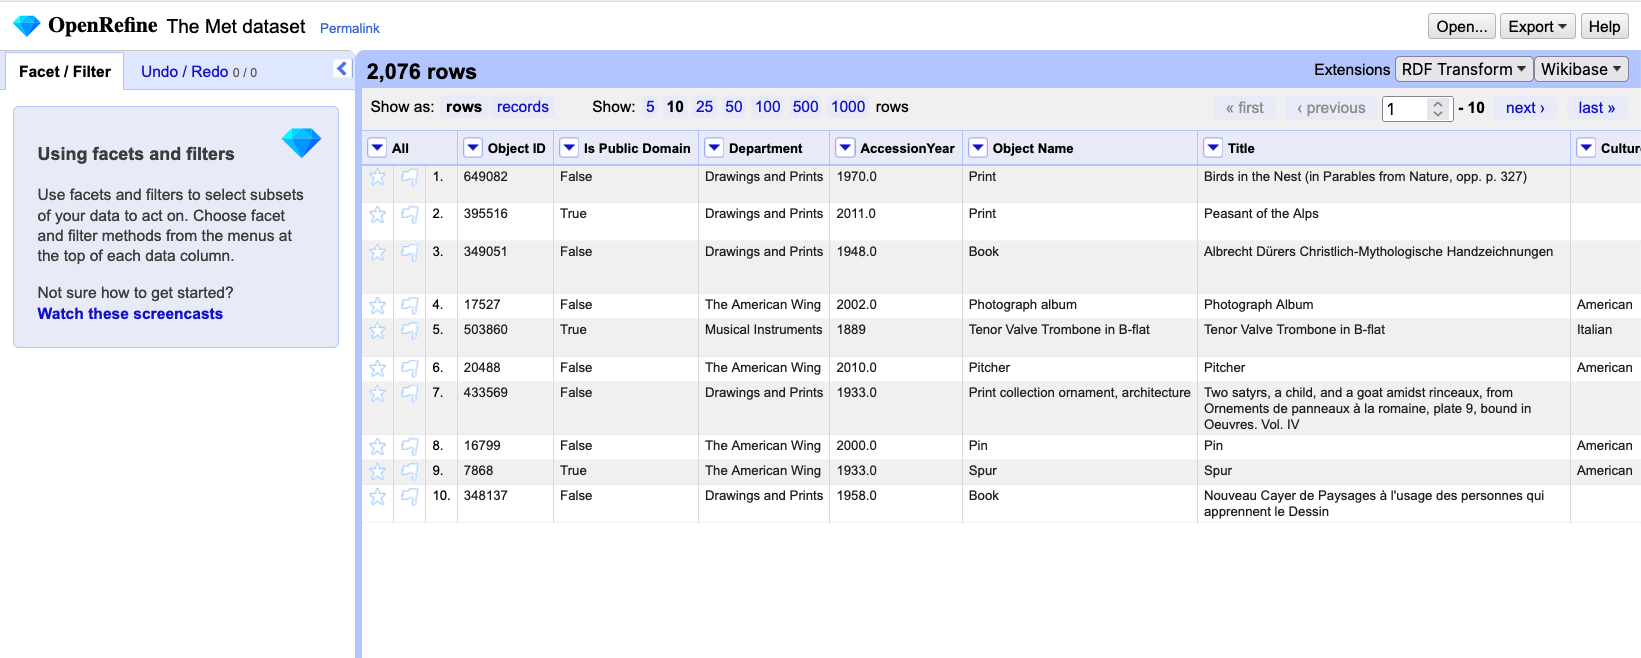
The OpenRefine interface is organized around a central workspace. The main window displays the data in a tabular format called the grid, with rows and columns similar to a spreadsheet: A row represents a record in your dataset, and every column represents a type of information. Above the table in the grid header, you can choose how many rows are shown at once, and you can scroll through the columns within the table.
Each column header has a small arrow. Clicking this
arrow opens a drop-down menu with actions that apply only
to that column, such as sorting, faceting, and editing its values: These
are the actions you learn about in the following chapters
On the left-hand side, the Facet/Filter tab shows all
active filters and facets. These tools allow you to explore the dataset
and to see how your actions affect it. The Undo/Redo tab
records every change you applied to the data. From here, you can step
backward or forward through your changes. Note: All changes are
stored within the OpenRefine project; the original file remains
unchanged. You will use both tabs a lot in the following
episodes.
Lastly, in the right corner of the project bar, the
menu provides access to project-level actions. When you click on
Open..., you return to the start page. The
Help button links to the official OpenRefine documentation.
If you encounter problems in the future, the official documentation is a
useful starting point.
Now that we have successfully imported the dataset and understood the interface, we can begin exploring the data itself.
- OpenRefine organizes your work in projects
- You can import data from different sources and in different formats into OpenRefine
- Adjust import settings to ensure your data is read correctly and preview the results before starting
- The main components of the user interface are the grid, the grid
header, the project bar, and
Facet/Filteras well asUndo/Redotab
Content from Exploring Data
Last updated on 2026-06-24 | Edit this page
Overview
Questions
- What options does OpenRefine offer for data exploration?
- What is a facet and how does it help me explore data?
- How do facets differ from filters?
- What data types exist in OpenRefine?
Objectives
- Define faceting and identify when to use it.
- Define filtering and identify when to use it.
- Create a text facet to get an overview of values in a column.
- Transform values from one data type to another.
- Use Split multi-valued cells to prepare data for accurate faceting and later analysis.
Facets
When we work with data in OpenRefine, one of the first challenges is to make sense of the information that has been imported. Looking at rows of raw data rarely gives us much insight, especially if the dataset is large. What we need is a way of quickly summarizing values, spotting patterns, and finding potential problems such as inconsistent spellings or unexpected categories.
OpenRefine provides a set of tools for this under the name facets. Faceting allows us to group together all of the different values that appear in a column and to see how often they occur. A facet creates a kind of “interactive summary” of the data: it lists all unique values in a column and shows how many times each one appears.
Text Facet
The most commonly used facet type is called text facet. This facet
type applies to all string values. We create our first text facet
together for the column Department. Open the column menu
with the small arrow next to the column name and choose
Facet → Text facet. A new panel appeara on the left side of
the screen showing the unique values in the column and how often they
occur. You can sort the values alphabetically or by frequency. You can
also hover over values to edit them directly. This simple step
immediately transforms a spreadsheet with hundreds of rows into a clear
summary of categories and helps identify initial inconsistencies.
Both “Arts of Africa Oceania and the Americas” and “Arts of Africa, Oceania and the Americas” appear in the panel. Since these values most likely refer to the same department, the version without the comma is probably a data entry error. To correct this, identify the incorrect value in the facet list, hover over it, click edit, and change it. This merges all records under the correct spelling by just one action.
You can also click on one department to see only those rows in the table, or select multiple values to combine them by clicking include. Ensure that you undo your selection by pressing exclude, otherwise you only continue working with a small subset of the data.
First Insights into Your Dataset & Correct Errors
Create a text facet on the columns:
Is Public DomainObject NameCity.
- How many unique values are listed in each column?
- What is the most common value in
Object Name/Cityand how often does it appear? - Can you spot and fix the problems in the
Is Public Domaincolumn?
- 4 / 389 / 321 different values.
- The most frequent value is Book with 493 counts and Paris with 439 counts.
- There are inconsistent capitalizations: “False”, “false” and “true”, “True”. You can decide for one spelling and edit the others with the edit button.
The difference between Facets and Filters
It is useful to distinguish between facets and filters. Both are ways of focusing on a subset of the data, but they work differently. A filter is like a search box: you type in a word or part of a word, and OpenRefine hides all rows that do not match. A facet, by contrast, gives you an overview of all the distinct values in a column (as you saw in the Challenge above) and lets you select them interactively.
For example, in the Met dataset, the column Department
might contain categories such as “Medieval Art”, “Islamic Arts,” or
“Drawings & Prints.” A text facet on this column immediately shows
you how many artworks belong to each department. By clicking on one or
several values in the facet, you can quickly restrict your view to only
those artworks, and then easily switch back to the full dataset. Using
this functionality, you can filter your data through the facet
interface.
Another way to filter values in a column is to use a text filter.
When you choose Filter → Text filter, a search field
appears on the left side. You can type a term to restrict the dataset to
matching rows.
Combining Facets and Text Filters
How many prints are in the department “Drawings and Prints”? What difficulties arise when you only use filtering via the include function of the facet?
First, create a text facet on the column Department and
filter for the department “Drawings and Prints” via include. Then you
can use a text facet on the column Object Name. When you
include the facet “Print”, you find 281 matching records. However, the
results only include exact matches with “Print” not simliar values such
as “Print collection ornament & architecture” and other similar
ones.
To filter for all prints in the department, you can use a text filter and type “print”. There are 665 prints in the department.
Rows, Records, and Multi-Valued Cells
Up to this point, we have assumed that every cell in a column
contains only a single value. In real-world data, however, that is often
not the case. In the Met dataset, the Artist Display Name
column sometimes contains two or more names, separated by a
| like Horace Harral|Joseph Wolf. This is
problematic for faceting. If we want to find out which artist appears
most frequently in the dataset, this structure makes it difficult.
That’s because if we apply a text facet to the
Artist Display Name column as it stands, OpenRefine treats
the entire string as one value. The facet then lists the artists as if
it were a single artist, which is clearly not what we want. What we need
instead is to treat each artist as a separate value:
Horace Harral and Joseph Wolf.
To understand what happens when we correct this, it helps to know about the distinction between rows and records in OpenRefine. By default, data is displayed as rows, one after the other. But OpenRefine can also treat a group of rows as belonging to the same record. When we split a cell that contains multiple values, OpenRefine creates additional rows within the same record. This means that the number of rows increases, while the number of records remains unchanged.
- Switch to
recordsat the top left of the grid. This makes it easier to see what happens after the split. - Open the column menu for
Artist Display Name, chooseEdit cells → Split multi-valued cells…. Enter the separator|in the box, and clickOK. - Create a text facet on
Artist Display Nameagain. This time you see the names of individual artists listed separately. Each can now be counted and selected on its own.
If you now switch back to the rows view you will see
that the number of rows increased to 4,644.
Split multi-valued cells
The column Tags also contains multiple values in some
cells. Split the cells for this column and create a text facet.
Which separator do you need?
Which tag appears most frequently in the dataset?
Do you notice duplicate values in the facet list?
When splitting the cells, you should use a pipe (
|) as the separator.After splitting the values and creating a text facet, the most frequent tag in the dataset is “Men”.
The facet may show duplicate values. These appear as separate values because some tags contain leading whitespace. To fix this you can
Edit cells → Common transforms → Trim leading and trailing whitespace. This removes spaces at the beginning or end of the cells. After trimming the whitespace, the duplicate values merge into a single tag.
Rejoining Values
Sometimes you may want to put the data back into its original form.
After cleaning or analyzing, OpenRefine allows you to join split rows
back into a single cell. To do this, return to the column menu, select
Edit cells → Join multi-valued cells…, and specify a
separator again. This is useful if you need to export the data in a more
compact form later.
Other Facet Types
So far we have used text facets to explore categorical values such as departments or object types. OpenRefine also offers other facet types that help explore numeric values like creation year of an artwork.
Let us try this out with the Object Begin Date column
from the Met dataset which contains the year an artwork was created.
Open the column menu and choose Facet → Numeric facet. You
might expect to see the different values, but instead, OpenRefine
displays a message such as “No numeric values.” This tells us that the
values in the column are not actually recognized as numbers, even though
they look like numbers in the table.
This situation is common when importing data: numbers are often stored as strings (that is, as text), so OpenRefine does not treat them as numeric values. We need to transform them first.
To fix this, open the column menu for Object Begin Date
again and choose:Edit cells → Common transforms → To number.
OpenRefine now attempts to parse each cell in that column as a number. If the value is a valid number, the cell is converted; if not (for example, if the cell is empty or contains text like “unknown”), it becomes a blank cell.
You see a small change in the formatting of the numbers: they are now right-aligned, which is OpenRefine’s way of indicating that they are numeric rather than text.
With the column properly converted, repeat the earlier step:Facet → Numeric facet.
This time, OpenRefine shows a histogram with a slider to explore ranges of values from year 0 up to year 2100. The histogram groups the year values into intervals of 100 years, giving you an overview of how artworks are distributed by year of their creation.
By dragging the slider handles, you can focus on particular ranges. For example, you might restrict the view to artworks before 1,500. You see that the dataset contains only 42 matching objects. Most artworks therefore date from after the 15th century; this is evident at a glance.
Numeric facets therefore serve two purposes at once: they help you explore distributions, and they highlight anomalies that need cleaning.
OpenRefine also offers other facet types such as a timeline facet for
date values or a scatterplot facet for exploring the relationship
between two numeric columns. In addition, OpenRefine provides a facet
type that helps you identify duplicate values in a column:
Facet → Customized facets → Duplicate facet. Duplicate
facets can be useful, for example, when working with columns that are
expected to contain unique identifiers.
The best way to understand these facets is simply to experiment with them.
Numeric Facet
Turn the values in the column Accession Year into a
numeric facet. In which decade did the Met collection acquire the most
artworks? Why are there non-numeric values? Can you spot the error?
In the 1940s. There are 5 non-numeric values. You can take a look at them by ticking Non-numeric. It looks like someone wrote an “O” instead of a “0”.
Detect Blank Values
Not every object contains information in all columns. Often, the data
is incomplete. Knowing how incomplete the data is can often be important
for planning a later analysis. We can quickly identify the gaps by
selecting Facet → Customised facets → Facet by blank. This
gives us an output with “true” and “false” on the left. By selecting
“false”, we exclude rows with missing values from the subset. If we do
this for all columns, we only get the data records that are
complete.
Identify complete records
How many records in the dataset contain information on both
Culture and Tags?
First apply Facet by blank to Culture and
select “false”. Then apply Facet by blank to
Tags and select “false”. Only the remaining 175 records
contain values in both columns. This is quite a small number,
considering that the dataset contains 2,076 records.
- Facets provide an interactive overview of the values in a column and help you explore your data.
- Multi-valued cells must be split before accurate faceting is possible.
- Numeric and Timeline facets require converting text values into numbers or dates first.
Content from Custom Facets and GREL
Last updated on 2026-06-24 | Edit this page
Overview
Questions
- When do we need a custom facet instead of a built-in one?
- How can GREL help us explore and classify data more flexibly?
Objectives
- Understand what a custom facet is and how it differs from standard
facets.
- Learn to write simple GREL expressions for filtering and classifying
data.
- Create custom facets using GREL expressions to group and analyse data in new ways.
Creating a Custom Facet with GREL
How can we tell whether a cell contains one artist or several artists?
How can we check the column Artist Display Name to find
out whether one or more people were involved in creating an artwork
without splitting it? Look carefully at a few cells. What character
consistently separates multiple names?
So far, we have explored facets that you can create by clicking through the menu—text, numeric, and timeline facets. These are powerful, but sometimes an exploration or cleaning task requires a rule that is not built in. In those cases, OpenRefine lets us define our own facets using small expressions written in GREL. Don’t worry if these terms are new to you. We demonstrate them with an example based on the dataset you already explored in the previous episode.
Open the column menu for
Artist Display Name.Choose
Facet → Custom text facet…
-
Enter the following expression:
value.contains("|")This expression asks, “Does the cell contain a pipe?” For each row, OpenRefine evaluates the expression and returns either
trueorfalse. Click
OK. In the left panel, you now see a facet with two categories:trueandfalse.
This small expression creates a logic-based facet that is not available as a built-in facet. It does not modify the data. It simply checks whether the condition is true or false for each row.
Why this works: A Custom facet runs your expression on every row,
groups the results, and lets you filter by the outcome. You can write
tests that return booleans (true/false),
strings (e.g., normalized categories), or even numbers — OpenRefine
facets whatever the expression returns.
Finding Titles with Quotation Marks
Create a custom text facet on the Title column and
determine how many titles contain quotation marks. Then inspect a few
examples and discuss why quotation marks might have been used.
Tip: You need to escape the quotation mark in the expression using a
backslash (\).
The expression is:
value.contains("\"")It returns 79 rows with the value true, meaning that 79
titles contain quotation marks. Looking at several examples suggests
that quotation marks are often used when the title refers to a component
of a larger work, such as an illustration in a book. This information
could be important for a later analysis.
What Is GREL?
GREL stands for General Refine Expression Language. It is a small, specialized language used inside OpenRefine to:
- inspect cell values
- transform text and numbers
- check conditions
- extract patterns
- create new values on the fly
GREL looks like code, but many useful expressions are short and
readable. You can think of them as tiny instructions that tell
OpenRefine how to interpret or transform the value currently in a cell
(that value is referred to as value inside GREL). Many of
the actions we have already performed can also be expressed directly in
GREL, but to make things easier the most common functions are already
built in. The menu simply provides shortcuts for the most common
actions.
Detecting unusually long titles
Very long artwork titles may indicate data issues, such as multiple titles stored in one cell or comments included in the title field, but they can also reflect descriptive cataloguing practices.
Create a custom text facet on the column Title using the
following GREL expression:
if(value.length() > 40, "long title", "short title")What does this expression do in your own words?
How many long titles are there in the dataset?
The expression works as follows:
Inspect the cell with
value.length(), which calculates the number of characters in the title.The
if()function checks whether the title has more than 40 characters (value.length() > 40).Produce a new output. If the condition is true, the expression returns “long title”, otherwise it returns “short title”. OpenRefine then groups rows according to these generated values.
This means the facet does not group by the original cell content, but by values that are generated by the expression.
There are 1009 long titles in the dataset. Looking at these entries shows that many titles include a description in addition to the actual title.
Coming back to our column Artist Display Name, you can
also ask a more complex question: How many artists contributed to each
artwork? This question cannot easily be answered using the menu
interface alone. Instead of simply asking whether a pipe exists, we can
count how many artist names are stored in a cell. To do this, we first
split the text into a list and then count how many elements the list
contains.
value.split("|").length()In this expression, we chain two operations together. First,
split() creates a list of names. Then
.length() counts how many elements are in that list. In the
window where you enter your GREL function, you can see the result it
produces as you type.
Working with GREL always starts with a question about the data. That’s why we’re going to take a look at the most common GREL functions and what they do.
Callout: GREL-Functions
Good places to look up your problem and the corresponding GREL function are:
Some useful functions include:
-
value.toLowercase()– lowercase the text. -
value.trim()– remove spaces at start/end. -
value.length()– number of characters. -
value.contains("text")–trueif “text” occurs. -
value.startsWith("A"),value.endsWith(".")– prefix/suffix checks. -
value.replace("old","new")– literal replace. -
value.replace(/\s+/," ")– regex replace (collapse multiple spaces). -
value.split(";")– split into an array on;. -
array.join("|")– join array back to a string.
- Custom facets group data using computed results from a GREL
expression, not only the original cell values.
- GREL is a lightweight language that allows you to inspect, classify, and analyse data inside OpenRefine.
- Custom facets let you ask flexible questions about your data, such as identifying multiple creators or unusually long titles.
- With conditional expressions like
if(), you can define new categories that support deeper exploration and data-quality checks. - GREL functions can be chained together to answer more complex questions about your data.
Content from Transforming Data
Last updated on 2026-06-24 | Edit this page
Overview
Questions
- How can GREL be used to extract information?
- What is the difference between modifying existing values and creating new columns?
- How can clustering help identify inconsistent values in a dataset?
Objectives
- Apply GREL transformations to extract information.
- Create new columns based on existing data.
- Use arrays and indexing to select specific parts of a value.
- Use clustering to identify and review inconsistent values.
From Exploring Data to Cleaning Data
In the previous episodes, we used built-in and custom facets to explore our dataset and identify potential issues. Facets help us find patterns and problems, but they do not change the data itself. For further analysis, it is often useful to reorganize and standardize the data.
In this episode, we move from exploration to cleaning. We use transformations, column operations, and clustering to modify and standardize our data.
What information is stored in
Artist Display Bio?
Look at several values in the column.
- What different kinds of information are stored together?
- What problems could this cause for later analysis?
- How could we separate these different pieces of information?
Splitting Multi-Valued Cells
The first step is to separate information about individual artists.
As you learned in previous episodes, the pipe character (|)
is used to separate information about multiple artists within a single
cell.
To separate these artists into individual rows:
Open the column menu for
Artist Display Bio.Choose
Edit cells → Split multi-valued cells...Enter:
|.Confirm with
OK.
You notice that some artists have only partial information, while
others have much more detailed entries. Most complete entries follow a
pattern similar to: Nationality, Place Year–Year Place.
Creating New Columns and Extracting Information
Now we can begin extracting specific pieces of information. To preserve the original data, we create a new column rather than modifying the existing one. This is an important distinction: unlike the previous operation, which changed the structure of the dataset by creating new rows, we are now creating an additional column while keeping the original values unchanged.
How to extract the Nationality?
Look at the column Artist Display Bio. How could you
separate the nationality from the remaining information?
Most values follow the pattern:
Nationality, additional biographical information
We can therefore split the text at the first comma and keep only the first element.
Open the column menu for
Artist Display Bio.Choose
Edit column → Add column based on this column...A new window appears.
- Name the new column
Nationality. - Enter the GREL expression and check what happens in the
Previewtab below
value.split(",")The cell content is transformed from text into an array with three elements:
American (born Germany), Frankfurt-am-Main 1863–1962 Staten Island, New York
→
[ "American (born Germany)", " Frankfurt-am-Main 1863–1962 Staten Island", " New York" ]
The list is called an array and stores the elements or values in a
specific order. In OpenRefine, arrays are displayed unsing square
brackets with elements separated by commas:
[value1, value2, value3]. Each element has a position,
called an index. Counting starts at 0, so the first element is accessed
with [0], the second with [1], and so on.
Since we are interested in the nationality, we only want the first
element of the array.
Add
[0]to the end of the GREL expression.Click
OKto create the new column.
Additional cleaning
Look at the new Nationality column. It seems that the
cells contain more than just nationalities. Discuss the following
questions:
- Which additional information is still present?
- Can you identify recurring patterns?
- How might these patterns be removed?
You do not need to propose a GREL expression. A description in natural language is sufficient.
Common issues include:
- Birth information in parentheses, such as
(born Germany). - Uncertainty is marked with
(?) - Entries containing dates instead of nationalities.
- Entries containing place names where no nationality was recorded.
- Leading or trailing whitespace introduced during splitting.
- Information about active periods, such as
active 16th century.
Data cleaning is rarely finished after a single transformation. Manual review is still necessary, but transformations can greatly reduce the amount of work required.
Extracting Life Dates
Once we have extracted the nationality, we can use a similar strategy to isolate other information stored in the same field. Life dates are another important piece of information that may be useful for later analysis.
Create a new column containing only the life dates of the artists.
Look again at the values in Artist Display Bio. Can you
create a new column that contains only the birth and death years?
Most life dates contain digits and a dash separating birth and death year.
One possible solution is:
value.replace(/[^0-9–-]/,"")Explanation: value.replace(pattern, replacement)
replaces all parts of a value that match a given pattern.
In this example:
-
/ ... /indicates that the pattern is written as a regular expression. -
[0-9–-]matches any digit (0–9) as well as dashes (-and–). -
^inside the square brackets reverses the selection. It means “anything except” the listed characters.
Therefore: [^0-9–-] means: match every character that is
not a number or a dash.
The replacement string is empty (""), so all matching
characters are removed.
Clustering
Even after applying transformations, some inconsistencies remain. Not
all problems can be solved with rules or regular expressions. Sometimes
values differ only slightly because of spelling variations,
abbreviations, or typing mistakes. In these cases, clustering can help
identify potentially equivalent values. It identifies and normalizes
variations — especially when different inconsistencies appear similar
but not identical. We demonstrate clustering on the column
Object Name.
Open the column menu for
Object Name.Choose
Edit cells → Cluster and edit....A new window appears. Click
Cluster.
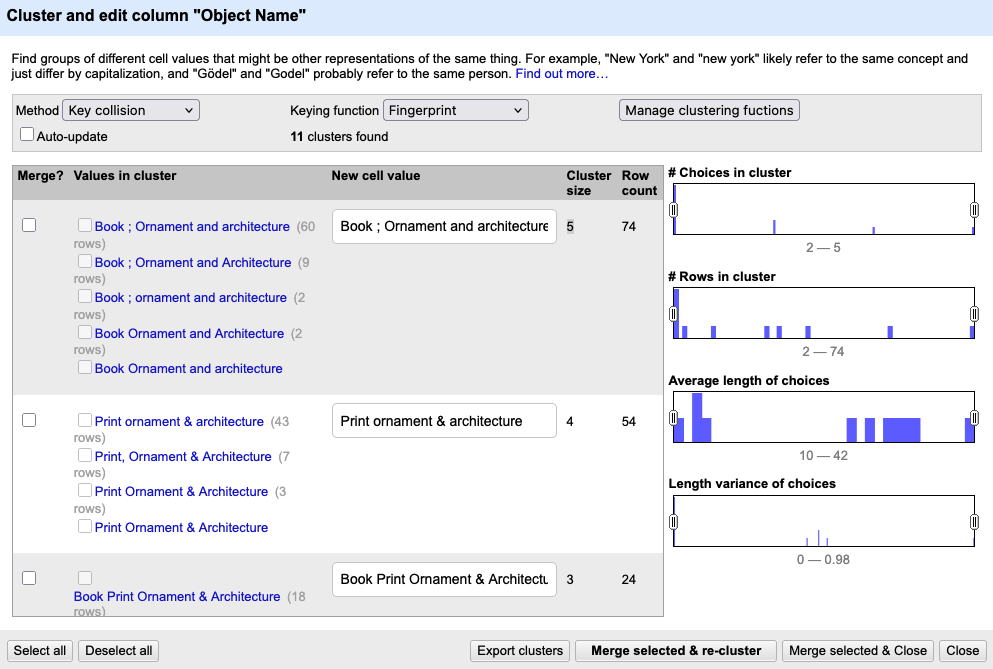
The clustering window displays one suggested cluster per row. For each cluster the variations of a similar value with the count of rows they appear are shown on the left; a field on the right allows you to select or edit a preferred value.
For every suggested cluster you can decide to merge the values into a standardized form, to ignore the cluster if the variations are meaningful or to edit only some entries of the cluster. Clustering never changes anything automatically. OpenRefine simply helps you notice patterns you would otherwise miss.
Different clustering methods and keying functions identify different kinds of similarities. You do not need to understand the underlying algorithms. In practice, it is often sufficient to experiment with several methods and compare the results.
Cluster the Classification
Look at the column Classification and try clustering the
values by using different clustering methods and keying functions
- Which method produces the most useful suggestions?
- Which values are grouped together?
- What preprocessing step could improve the clustering results?
There is no single correct answer. Different clustering methods produce different suggestions.
One useful preprocessing step is to split multi-valued cells before clustering. If several classifications are stored together in one cell, clustering has difficulty identifying similarities between individual values.
- GREL expressions can be used to extract, modify, and standardize information.
- Creating new columns preserves the original data and makes transformations easier to review.
- The
split()function creates arrays that can be accessed using positions such as[0]and[1]. - Structured information can be extracted from text using GREL expressions and pattern matching.
- Data cleaning often requires multiple transformation steps and manual review.
- Clustering helps identify potentially equivalent values and supports manual standardization.
Content from Reconciling Data with External Data Sources
Last updated on 2026-06-24 | Edit this page
Overview
Questions
- What does it mean to reconcile data?
- Why is reconciliation useful in humanities research?
- How can we use OpenRefine to enrich our dataset with identifiers and structured information?
Objectives
- Understand the concept of data reconciliation.
- Reconcile artist names with an authority database.
- Add stable identifiers to the dataset.
Why use reconciliation?
Up to this point we have cleaned and explored our dataset. We
standardized values, split columns, and corrected inconsistencies.
However, the values in the table are still plain text labels. For
example in the column Artist Display Name we find values
such as “Frank Lloyd Wright” and “Jean Le Pautre”.
For a human reader these values clearly represent people. A computer, however, only sees text. It cannot know whether “Frank Lloyd Wright” refers to the famous architect, another person with the same name, or a variant spelling used in another dataset.
This becomes a problem when we want to combine datasets, search across collections, or enrich our data with additional information. Computers need stable identifiers, not just names.
Reconciliation connects these text labels to authority records. Instead of working only with the name written in the dataset, we link the value to a stable identifier in an authority database.
For example, artists in our dataset can be linked to records in the Getty Union List of Artist Names (ULAN). Each person in ULAN has a unique identifier that distinguishes them from every other individual in the database: Frank Lloyd Wright (ULAN 500020307) or Jean le Pautre (ULAN 500000036).
When a name in our dataset is reconciled with an authority record, we are essentially answering the question: Which exact person in this authority database corresponds to the name written in our dataset?
Quick check
Open the Union List of Artist Names (https://www.getty.edu/research/tools/vocabularies/ulan/) and search for “Frank Lloyd Wright” and “Jean Le Pautre”.
Why is it not always obvious which authority record is the correct one?
What information in the authority record helps you decide?
What kinds of information are available in ULAN that are not present in our dataset?
There are several search results for both. You have to check exactly which result is the right. ULAN records often contains additional structured information such as birth and death dates, occupations, as well as different spelling of names.
Authority searches may return multiple results like in these cases. To identify the correct person you need to compare additional information such as life dates, occupations, or alternative spellings in the authority data and your dataset.
Reconciling with OpenRefine
Because reconciliation can be computationally expensive, we will
first work with a subset of the dataset. Make a text facet in the column
Departmentand form a subset from the department “Drawings
and Prints”.
Open the menu on the column
Artist Display Nameand selectReconcile → Start reconciling…A new window appears, where you select
Discover services...and a new browser tab opens with all the possible reconciliation services in OpenRefine. Search for “Getty ULAN” and copy the URL “https://services.getty.edu/vocab/reconcile/”.Now return to your other browser tab, select
Add standard service...and paste the copied URL into the appearing field. SelectAdd service.Select the service and click on
Next.Select
ULAN search, then clickStart reconciling....
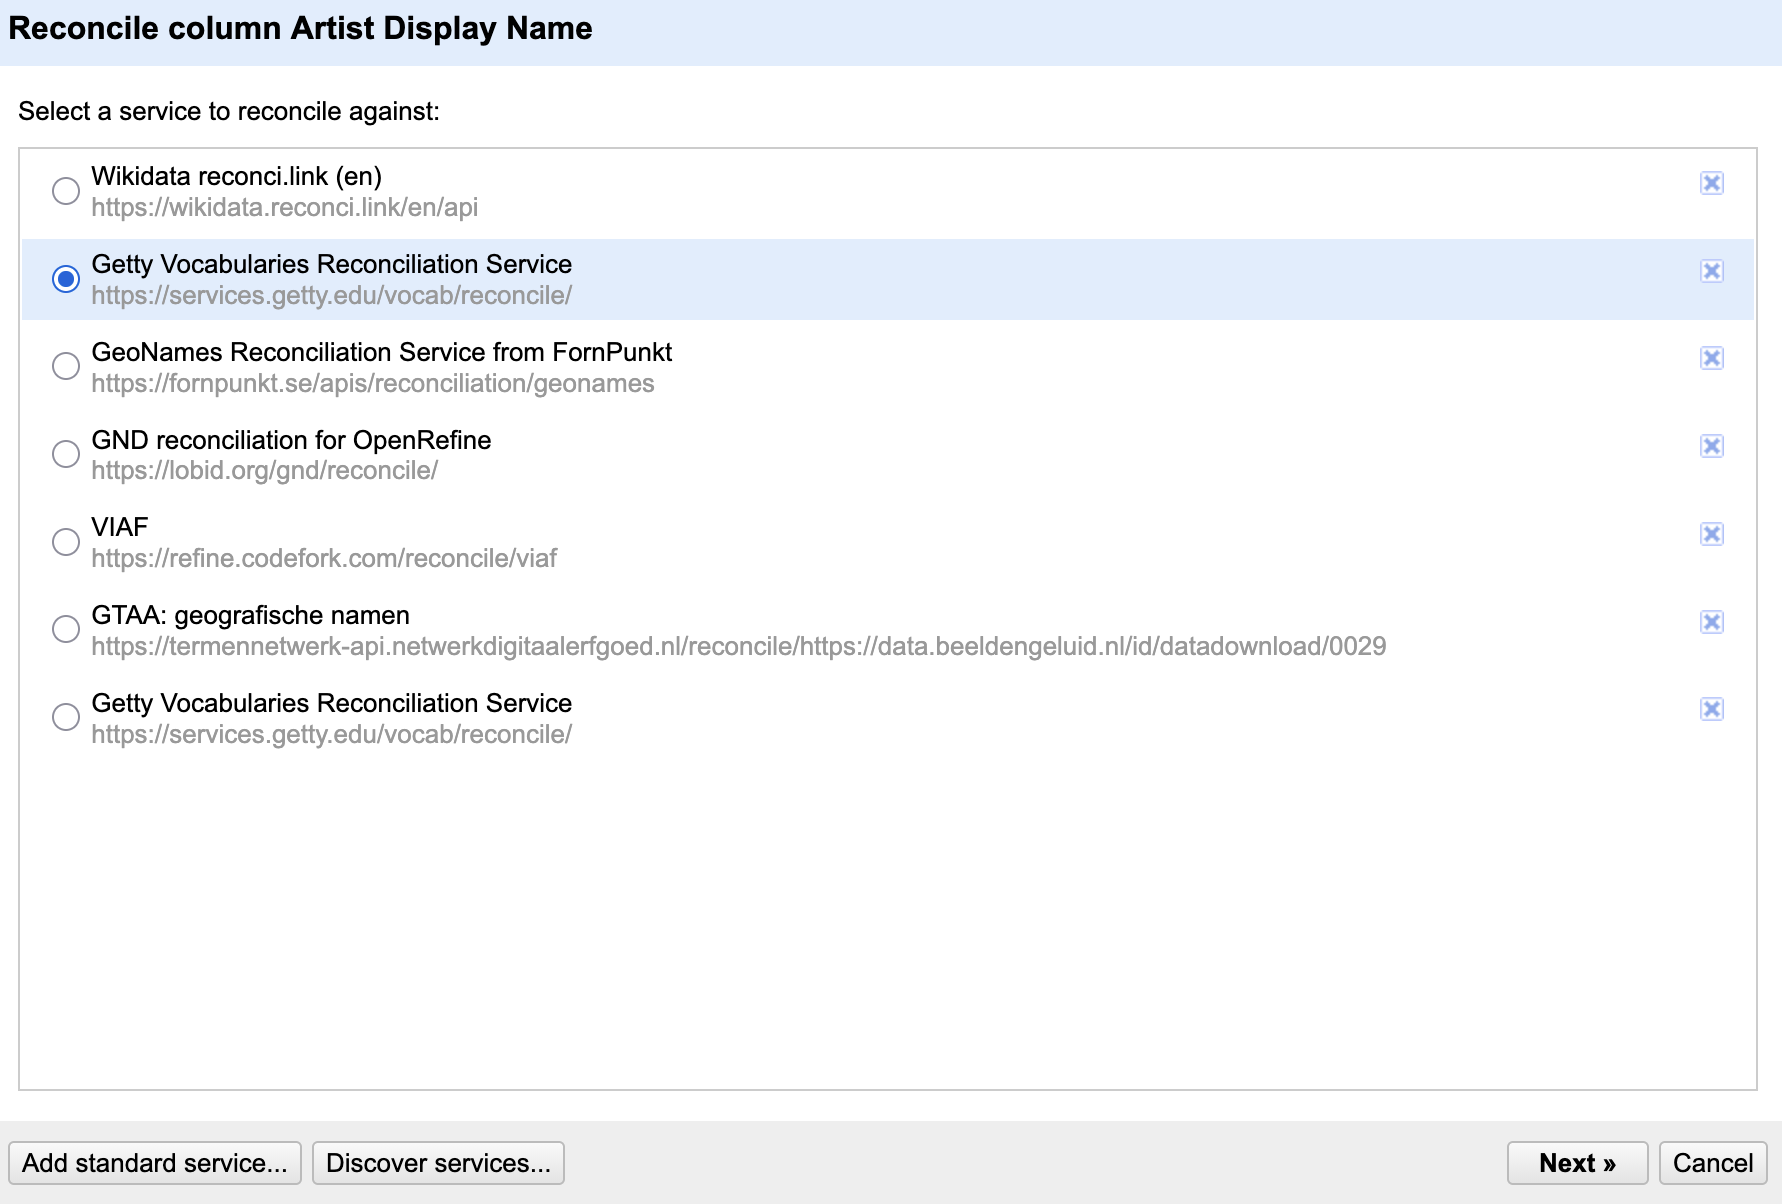
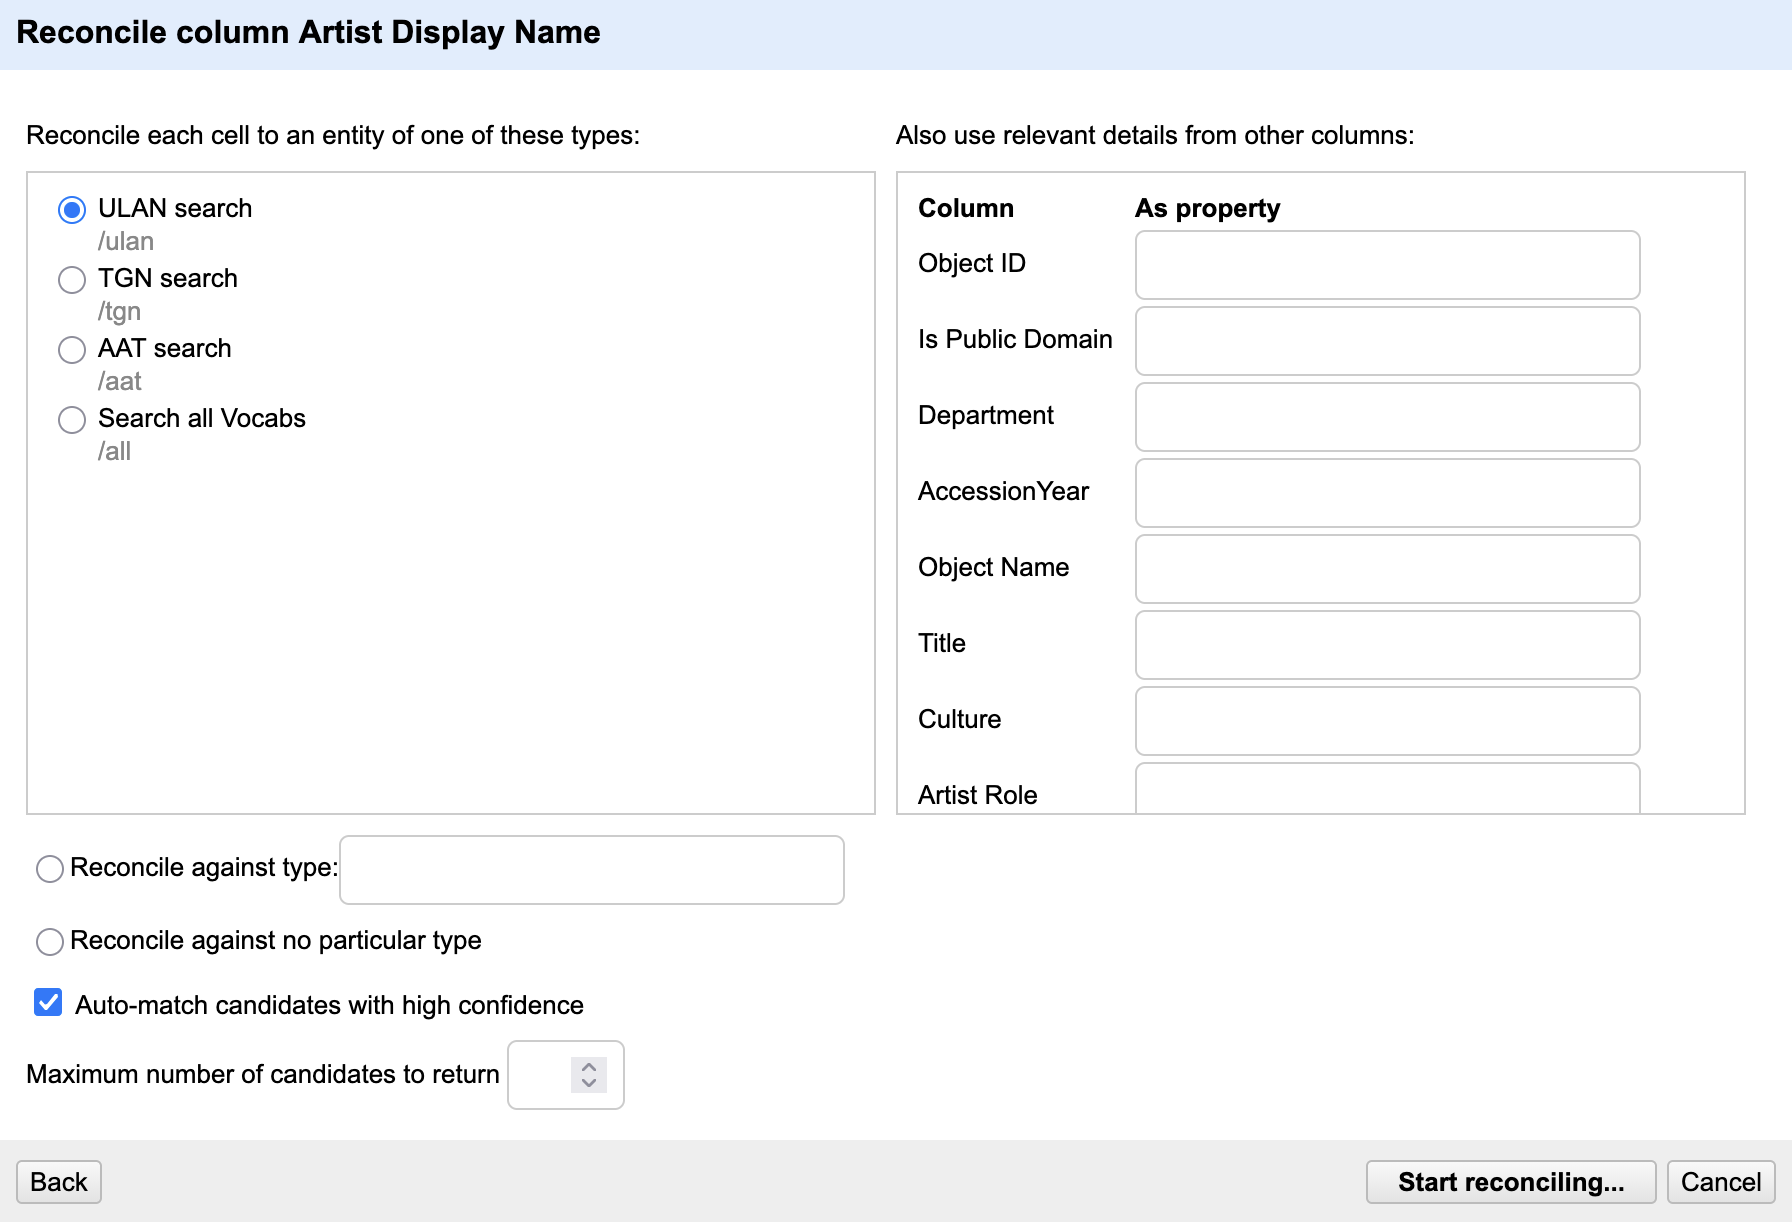
OpenRefine now sends each name in the column to the Getty database and suggests possible matches.
Compare Reconciliation Services
So far, you have reconciled artist names against Getty ULAN.
OpenRefine can also connect to many other authority databases – like
Wikidata, VIAF (Virtual Authority File) or GND (Integrated Authority
File). Add a second reconciliation service, such as Wikidata, VIAF or
the Integrated Authority File (GND) and reconcile the column
Artist Display Name again.
- Which reconciliation service did you choose?
- Does it return the same matches as ULAN?
- What additional information is available in the new authority database?
To add another service:
- Open
Reconcile → Start reconciling… - Select
Discover services... - Search for a reconciliation service.
- Copy the service URL and add it via
Add standard service.... - Start a new reconciliation process.
Different services may return different matches and provide different metadata. For example, Wikidata often includes links to many external databases, images, and biographical information, while VIAF and GND focus on authority control in libraries and archives.
The most useful service depends on your research question and the type of information you want to add to your dataset.
Reviewing the matches
If OpenRefine finds a clear match, the reconciliation is applied automatically. If several possible matches exist, OpenRefine shows multiple candidates. Hovering over one of the names displays some information to help you decide which person is correct. You can also go directly to the entire database page to obtain even more information. Once you have found the correct person, you can either reconcile all cells with this name or just this one. Notice that OpenRefine also displays a confidence score. While high-confidence matches are often correct, they should still be reviewed, especially when several people share the same name.

Matchmaking
Find names in the column Artist Display Name where
OpenRefine suggests multiple matches.
Look carefully at the candidate entries.
What information helps you choose the correct match?
What might make a match ambiguous?
Helpful clues include life dates, nationality, occupations, or
alternative spellings.
Ambiguity often occurs when several people share the same name or when
the dataset contains little contextual information.
Adding identifiers
Reconciliation links are stored inside OpenRefine but are not automatically included when exporting the dataset. To preserve them we add an identifier column.
- Open the column menu
Artist Display Nameand chooseReconcile → Add entity identifiers column - Name the column something like “Artist_ULAN_ID”
The identifier column may not look very meaningful at first glance. However, identifiers are often more useful than names because they remain stable even when labels change. They allow different datasets to refer to the same person unambiguously.
- Reconciliation links text strings to unique identifiers in external databases.
- This makes your dataset more precise, reusable, and comparable across projects.
- OpenRefine suggests matches, but users should always review and confirm them.
- Identifier columns preserve these links when exporting the dataset.
Content from Exporting and Importing Data and Workflows
Last updated on 2026-06-24 | Edit this page
Overview
Questions
- How can we go back to an earlier step if we realize we made a
mistake?
- How can we save our cleaning process to repeat it later or share it with colleagues?
- How can we export the cleaned data?
Objectives
- Use the Undo/Redo tab to reverse mistakes.
- Export and Import workflows.
- Understand the value of transparency and reproducibility in data cleaning.
- Export data in different formats.
Undo/Redo
On the left-hand side of the OpenRefine interface, you find the
Undo/Redo tab. This tab lists every action you have taken
since the project was created. Each action has a short label, such as
“Text transform on 2000 cells… or “Split multi-valued cells
in column nationality”.
- Click on the
Undo/Redotab in the left sidebar.
- You see a list of all your steps in order. The most recent one is at
the bottom.
- By selecting an earlier step in the list, you can roll the dataset back to exactly how it looked at that moment.
This is like having a time machine for your dataset: you can test transformations freely without the fear of making permanent mistakes. And if you change your mind, you can always jump back to any earlier state. When cleaning messy data, we rarely get everything right on the first try.
Example: After splitting the Artist Display Bio column
into multiple parts, you might notice that the country information was
separated cleanly, but the century data became fragmented and less
useful. Using Undo/Redo, you can jump back to the step before
the split and try a different approach.
Exporting and Importing Workflows
Undo/Redo does more than let you move backwards. It also keeps track of your entire cleaning process as a set of instructions. OpenRefine can export these instructions as a JSON file. This file does not contain the cleaned data itself, but only the cleaning steps which were applied to the data.
- Go to the
Undo/Redotab.
- Click on the button
Extract....
- A dialog opens showing all the processing steps in JSON on the right side. You can select which steps to include into the JSON by selecting the checkboxes on the left side.
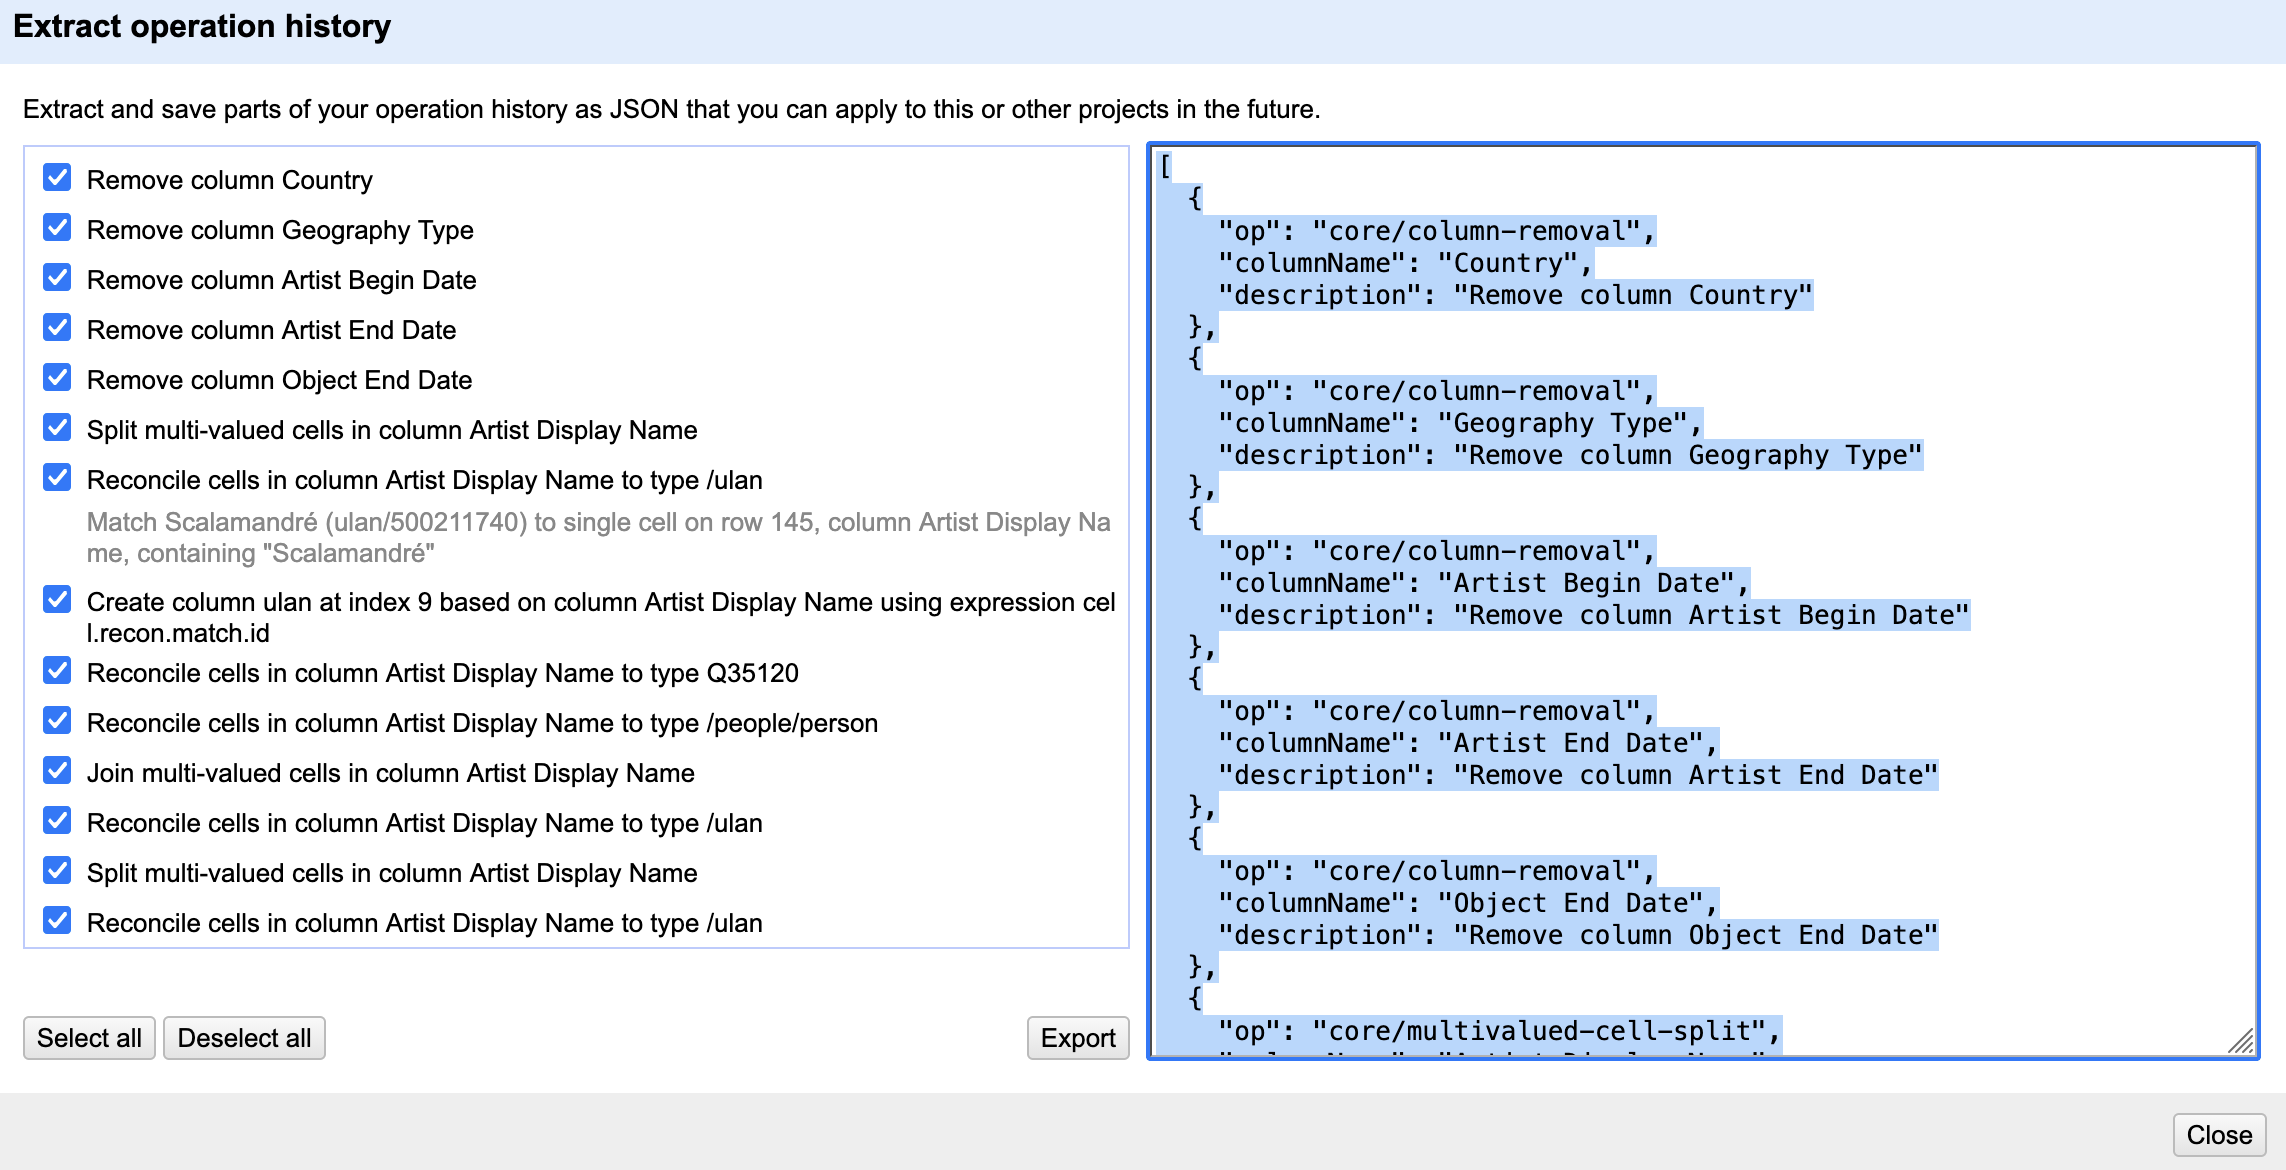 4. Save the processing steps
to a JSON file by clicking
4. Save the processing steps
to a JSON file by clicking Export or copy it manually to
your clipboard and paste it into a file on your computer.
Later, you or someone else can import this workflow into another
OpenRefine project by clicking Apply... in the
Undo/Redo tab in the other project. OpenRefine replays the
exact same steps on the new dataset.
This feature is especially powerful in research, where transparency and reproducibility are essential. Instead of describing vaguely what was done, we can share the precise workflow that produced our dataset. Other researchers can review it, replicate it, or adapt it to their own data.
Workflows as Reusable Recipes
Think of Undo/Redo export files as recipes. Just like a recipe tells you how to combine ingredients to bake a cake, an OpenRefine workflow tells you how to transform raw data into a cleaned dataset. If you don’t like the taste, you can always tweak the recipe.
Exporting data
The cleaned dataset can be exported in different formats like
tsv, csv, html depending on your
further planned work with the data. You find these options under
Export on the right side of the project bar. Here you also
have the option to export the entire OpenRefine project (data and
processing history) for sharing it with colleagues or as a project
backup. In this case you select
OpenRefine project to archive file and an archive file
(.tar.gz) will be downloaded to your computer.
Exporting pitfall
Ensure that no filters are active so that the entire dataset is exported. You can check this by looking at the information above the table, for example, “10 matching rows (1999 in total)”. In this case, only the subset of 10 data rows will be exported. Filters are easy to forget, especially when you have been exploring subsets of the data.
Reuse a Workflow
One of OpenRefine’s strengths is that cleaning steps can be reused on
similar datasets. Create a new OpenRefine project and import the
original data set again. Open the
Undo/Redo tab and apply the workflow JSON file you exported
earlier. Compare the new project with your previous project.
- Which changes were reproduced automatically?
- Did the workflow recreate the same columns, transformations, and cleaning steps?
- Why is this useful when working with larger datasets or collaborating with other researchers?
- OpenRefine records every transformation you make.
- The
Undo/Redotab lets you move backward and forward through your cleaning process.
- Workflows can be exported as JSON and reapplied to other projects, ensuring transparency and reproducibility.