Content from Introduction
Last updated on 2025-06-26 | Edit this page
Overview
Questions
- What is a relational database?
- What is a spreadsheet?
Objectives
- Explain the difference between a relational database and a spreadsheet
- Explain the advantages and disadvantages
Introduction
Discussion: Do you use tables and if so, for which tasks?
Spreadsheets, like Microsoft Excel, are used in many areas of application, but they have their limits in many places. Have you noticed any limitations or problems in your work?
Before we create a new database and fill it with information and data, we should learn the basic concept behind all this. What is a relational database or a spreadsheet, why should i use these and how do I organize my data to get the best use out of all these concepts. To understand the starting point where we are coming from, we want to understand the basic idea behind the concepts.
Spreadsheets
Spreadsheets are among the most versatile and widely used tools for
organizing, analyzing, and presenting data. They offer an intuitive
interface based on a grid of rows and columns, where users can input
data, apply formulas, and create dynamic calculations. Tools like
Microsoft Excel and Google Sheets are extremely accessible and powerful,
with functions such as SUM(), AVERAGE(),
IF() and VLOOKUP() that allow users to perform
both simple and complex data analysis without programming
experience.
In addition to basic operations, modern spreadsheets offer advanced features like pivot tables, conditional formatting, data validation, and even scripting capabilities via VBA or Google Apps Script. These make spreadsheets suitable for a wide range of applications, from budgeting and reporting to data collection and lightweight project management.
One of the major strengths of spreadsheets is their flexibility. Users can easily add or remove columns, merge cells, manually adjust content, and build structures that match their current needs. In many small or medium-sized projects, this flexibility is not just helpful, it’s essential for getting started quickly and without barriers.
However, this flexibility can become a weakness as data grows in
complexity. Spreadsheets are inherently flat . They’re
designed for two-dimensional data. The more users try to represent
relationships between different types of data (such as customers and
orders, or artworks and artists), the more fragile and error-prone the
spreadsheet becomes. Relationships are often created informally, using
copy-paste, repeated values, or formulas like VLOOKUP,
which are not resilient to structural changes or user mistakes.
As a result, spreadsheets can suffer from: - Data redundancy (the same information repeated in multiple places), - Inconsistencies (typos, outdated copies) - scalability issues (hard to manage as more people work on the same file or as data volume increases).
This is where relational databases come in. Not to replace spreadsheets entirely, but to offer a more robust and scalable alternative when the limitations of spreadsheets become apparent.
Relational Databases
Discussion: Do you use databases and if so, for which tasks?
You may have heard of databases and maybe even use them, but do you know how they work and why they are used? Do you know advantages or disadvantages?
Relational databases offer a structured and reliable way to manage complex, interrelated data. Unlike spreadsheets, which are flat and often lack enforced structure, relational databases store data in multiple related tables, each focusing on one specific type of information (e.g., users, products, orders). These tables are connected using primary and foreign keys, which define explicit relationships between them and ensure data integrity.
In a relational model, information is stored once and referenced when
needed. This minimizes redundancy, improves clarity, and makes data
easier to update, search, and extend over time. For example, instead of
writing an artist’s name next to every artwork, a database would store
that artist in a dedicated Artists table and simply link to
them via an ArtistID. This makes changes easy, avoids
duplication, and enables rich queries like “Show all artworks by artists
from France.”
Relational databases are typically queried using SQL
(Structured Query Language), a powerful language designed to
extract, modify, and manage data. SQL commands such as
SELECT, INSERT, UPDATE, and
DELETE allow users to interact with even large, complex
datasets in efficient and predictable ways.
While traditional database systems like MySQL or PostgreSQL require more technical knowledge than spreadsheets, modern no-code tools like NocoDB bridge that gap. These tools allow users to interact with databases through spreadsheet-like interfaces, while still benefiting from the structure and power of relational data models. In other words, they combine the usability of spreadsheets with the robustness of relational databases.
What is NocoDB?
NocoDB combines exactly these two concepts and allows us to create databases with the clear interface of a spreadsheet. It is a so-called ‘no code database’, which makes it possible to set up and use a relational database without any coding experience. NocoDB also allows us to work collaboratively in a team and even enter and use data without a special account. NocoDB is also open source. This means that we could theoretically set up our own instance and thus create and use our data completely independently of others. It also offers many other options for connecting and utilising our data on the Internet, which we will not go into in this course.
Content from Relational Databases
Last updated on 2025-06-26 | Edit this page
Overview
Questions
What is a relational database?
How do keys work?
What is a normal form?
Objectives
Understand the differences of normal forms
Normalize data in tables
In order to approach the topic as a whole, we first want to look at and understand the individual components in detail.
Tables (Relations)
Tables are a fundamental tool for organizing and processing data in a structured way. They consist of rows and columns, much like what you’re used to seeing in spreadsheet programs like Excel. Each column represents a specific attribute or characteristic—such as “Name,” “Date of Birth,” or “Email Address.” Each row represents a single data entry, showing the actual values for those attributes. More precisely, for example, each row represents a person and contains information about that person. This concept is transferable to all types of objects.
Example: Artists Table
| Name | Date of Birth | ID (Primary Key) |
|---|---|---|
| Thomas Eakins | 25.7.1844 | 1 |
| Bill Traylor | 1.4.1854 | 2 |
Tables provide a clear and easy-to-understand structure that works well for both humans and computers. They allow large amounts of information to be stored in an organized way, making it easy to search, sort, and analyze the data. The widespread success of tables comes from their simplicity, clarity, and versatility. They can be adapted to many different types of data and serve as an ideal starting point for everything from simple lists to complex data analysis.
Primary Key and Foreign Key
To structure and tidy up tables a little better, so-called keys are
used in relational data modelling. These keys are essential for creating
relationships between tables and ensuring that each entry can be
uniquely identified. A Primary Key is a column (or set
of columns) in a table that uniquely identifies each row. It must never
be empty and must be unique across the entire table. In the example
above, the ID column serves as the primary key for the
Artists table. It is also possible that the name is the primary key.
However, this does not guarantee that it is unique, as names can occur
more than once in a data record, even though they are different people.
A combination of name and date of birth could also be selected as the
primary key, but this is also not certain. For this reason, another
column is used that contains no information about the actual data
record, but makes it uniquely referencable. Now, if we want to store
information about artworks created by these artists, we could create a
separate table for artworks. Instead of repeating all the artist details
in the artworks table, we can use the artist’s primary key as a
reference. This reference, in the artwork table is called a
Foreign Key.
Example: Artworks Table
| Title | Artist (Foreign Key) |
|---|---|
| The Artist’s Wife and His Setter Dog | 1 |
| Blue Construction, Orange Figures | 2 |
The foreign key in the Artworks table (Artist) refers to
the primary key (ID) in the Artists table. This establishes
a relationship between the two tables, allowing us to link each artwork
to its artist without duplicating artist information. This separation of
data into related tables reduces redundancy and makes the database more
efficient and easier to maintain. However, for this to work effectively,
we must ensure that:
Key Points
The primary Key must never be empty and must be unique.
A foreign key must link to an existing Primary Key.
Keys enable relationships between tables and reduce data redundancy.
Normal Forms
As the amount of information in a table grows, it’s important to keep the data well-structured and manageable. This is where the concept of normal forms comes in, a systematic approach to organizing data so that it remains clear, consistent, and easy to extend. Normal forms build upon concepts you already know: tables (relations), primary keys, and foreign keys. They help avoid common issues in database design, such as:
- Data redundancy: storing the same information multiple times.
- Anomalies: unwanted side effects when inserting, updating, or deleting data.
- Lack of clarity: tables that are hard to maintain or expand.
Imagine you want to add new features in the future, new fields, relationships, or more advanced queries. If your tables are well-structured, you can do that with minimal effort. Normal forms help create a clean and flexible foundation for your data. Another key advantage: normalized data makes it easier to work with relationships between tables. The result is a model that is both logically sound and technically efficient. We will explore three normal forms: First (1NF), Second (2NF), and Third (3NF). Each builds on the previous one, addressing specific types of problems.
First Normal Form (1NF)
Callout: 1NF
The First Normal Form (1NF) is the most basic level of normalization. A table is in 1NF if:
- Each column contains atomic values: There should be no repeating groups or arrays within a single cell. Each field must contain a single value.
- Each record is unique: There should be no duplicate rows.
To illustrate, let’s consider a table of artworks from the Metropolitan Museum of Art (The MET) in New York. We start with the following unnormalized table:
| Title | Artist | Accession Number | On View Location |
|---|---|---|---|
| The Artist’s Wife and His Setter Dog | Thomas Eakins (American, Philadelphia, Pennsylvania 1844–1916) | 23.139 | The American Wing, 764 |
| The Champion Single Sculls (Max Schmitt in a Single Scull) | Thomas Eakins (American, Philadelphia, Pennsylvania 1844–1916) | 34.92 | The American Wing, 763 |
| A Gorge in the Mountains (Kauterskill Clove) | Sanford Robinson Gifford (Greenfield, NY 1823–1880 NY) | 15.30.62 | The American Wing, 761 |
| Marie Emilie Coignet de Courson (1716–1806) with a Dog | Jean Honoré Fragonard (French, Grasse 1732–1806 Paris) | 37.118 | European Paintings, 631 |
| Blue Construction, Orange Figures | Bill Traylor | 2015.756 | The Met Fifth Avenue in Gallery 773 |
| Christ Carrying the Cross, with the Crucifixion | Gerard David (Netherlandish, Oudewater ca. 1455–1523 Bruges) | 1975.1.119A-B | Robert Lehman Collection, 953 |
This table has several issues:
- The Artist column contains multiple pieces of information: name, nationality, birthplace, and birth-death years.
- The On View Location column combines the wing/department and the gallery number.
These non-atomic values make it difficult to search, sort, or filter by individual attributes (e.g., by artist nationality or gallery number).
To convert this table to 1NF, we split the composite fields into atomic values:
| Title | Artist Name | Artist Nationality | Artist Birthplace | Artist Birth–Death Years | Accession Number | Department | Gallery Number |
|---|---|---|---|---|---|---|---|
| The Artist’s Wife and His Setter Dog | Thomas Eakins | American | Philadelphia, Pennsylvania | 1844–1916 | 23.139 | The American Wing | 764 |
| The Champion Single Sculls | Thomas Eakins | American | Philadelphia, Pennsylvania | 1844–1916 | 34.92 | The American Wing | 763 |
| A Gorge in the Mountains | Sanford R. Gifford | American | Greenfield, NY | 1823–1880 | 15.30.62 | The American Wing | 761 |
| Marie Emilie Coignet de Courson | Jean H. Fragonard | French | Grasse | 1732–1806 | 37.118 | European Paintings | 631 |
| Blue Construction, Orange Figures | Bill Traylor | American | Benton, AL | 1854–1949 | 2015.756 | The Met Fifth Avenue | 773 |
| Christ Carrying the Cross | Gerard David | Netherlandish | Oudewater | 1455–1523 | 1975.1.119A-B | Robert Lehman Collection | 953 |
Now each column holds a single piece of information. This table is in 1NF.
However, we still have problems:
Redundancy: The artist details (e.g., Thomas Eakins) are repeated for each artwork by that artist.
Update Anomaly: If we need to update an artist’s birthplace, we must update it in every row for that artist. Missing one row would lead to inconsistency.
Insertion Anomaly: We cannot add a new artist without adding an artwork.
Deletion Anomaly: Deleting an artwork might remove the only record of an artist.
These issues are addressed by the Second Normal Form.
Second Normal Form (2NF)
Callout: 2NF
A table is in Second Normal Form (2NF) if:
- It is in 1NF.
- It has no partial dependencies; all non-key attributes must depend on the entire primary key.
In our example, let’s assume we have a composite primary key for the artworks table: (Title, Artist Name). However, note that:
- Artist Nationality, Artist Birthplace, and Artist Birth–Death Years depend only on Artist Name, not on Title.
- Department and Gallery Number depend only on the artwork, but not on Artist Name.
This partial dependency (non-key attributes depending on only part of the primary key) is not allowed in 2NF. To achieve 2NF, we split the table into two or more tables:
- Artists Table: Contains artist-related attributes.
- Artworks Table: Contains artwork-related attributes, with a foreign key to the artist.
Artists Table:
| ArtistID | Artist Name | Nationality | Birthplace | Birth_Death |
|---|---|---|---|---|
| 1 | Thomas Eakins | American | Philadelphia, PA | 1844–1916 |
| 2 | Sanford R. Gifford | American | Greenfield, NY | 1823–1880 |
| 3 | Jean H. Fragonard | French | Grasse | 1732–1806 |
| 4 | Bill Traylor | American | Benton, AL | 1854–1949 |
| 5 | Gerard David | Netherlandish | Oudewater | 1455–1523 |
Artworks Table:
| ArtworkID | Title | Accession Number | Department | Gallery Number | ArtistID (FK) |
|---|---|---|---|---|---|
| 1 | The Artist’s Wife and His Setter Dog | 23.139 | The American Wing | 764 | 1 |
| 2 | The Champion Single Sculls | 34.92 | The American Wing | 763 | 1 |
| 3 | A Gorge in the Mountains | 15.30.62 | The American Wing | 761 | 2 |
| 4 | Marie Emilie Coignet de Courson | 37.118 | European Paintings | 631 | 3 |
| 5 | Blue Construction, Orange Figures | 2015.756 | The Met Fifth Avenue | 773 | 4 |
| 6 | Christ Carrying the Cross | 1975.1.119A-B | Robert Lehman Collection | 953 | 5 |
Now, the Artists table has a primary key ArtistID, and the Artworks table has a primary key ArtworkID and a foreign key ArtistID linking to the Artists table. This design eliminates the redundancy of artist information. However, we still have an issue: The Department and Gallery Number in the Artworks table might not be entirely dependent on the artwork.
Third Normal Form (3NF)
Callout: 3NF
A table is in Third Normal Form (3NF) if:
- It is in 2NF.
- It has no transitive dependencies: non-key attributes must not depend on other non-key attributes.
In the Artworks table, we notice that the Department uniquely determines the Gallery Number. This means that the Department does not directly depend on the primary key (ArtworkID), but instead depends on another non-key attribute (Department). This is a transitive dependency and violates 3NF.
To resolve this, we move the information about galleries and departments into a separate table called Galleries. Each gallery has a unique identifier, its gallery number, and the associated department.
Galleries Table:
| GalleryID | Gallery Number | Department |
|---|---|---|
| 1 | 764 | The American Wing |
| 2 | 763 | The American Wing |
| 3 | 761 | The American Wing |
| 4 | 631 | European Paintings |
| 5 | 773 | The Met Fifth Avenue |
| 6 | 953 | Robert Lehman Collection |
Now, in the Artworks table, we replace the Department and Gallery Number columns with a single foreign key GalleryID that references the Galleries table:
Artworks Table (3NF):
| ArtworkID | Title | Accession Number | GalleryID (FK) | ArtistID (FK) |
|---|---|---|---|---|
| 1 | The Artist’s Wife and His Setter Dog | 23.139 | 1 | 1 |
| 2 | The Champion Single Sculls | 34.92 | 2 | 1 |
| 3 | A Gorge in the Mountains | 15.30.62 | 3 | 2 |
| 4 | Marie Emilie Coignet de Courson | 37.118 | 4 | 3 |
| 5 | Blue Construction, Orange Figures | 2015.756 | 5 | 4 |
| 6 | Christ Carrying the Cross | 1975.1.119A-B | 6 | 5 |
This design removes all transitive dependencies. Each non-key attribute now depends only on the primary key of its table. The database is now in Third Normal Form (3NF):
- No redundancy: Each piece of information is stored only once.
- Data integrity: Updates to a gallery or department are made in one place.
- Flexibility: New galleries, departments, artists, or artworks can be added without causing anomalies.
Further Normalization: Separating Departments
At this point, the database is fully normalized up to the Third Normal Form (3NF), which is sufficient for most use cases. However, for even greater flexibility and extensibility, you might consider separating the departments into their own table. This can be useful if:
- Departments have additional attributes (such as a description, head of department, or contact information).
- You want to ensure consistency and avoid typos in department names.
- You want to easily update department information in one place, even if many galleries belong to the same department.
To achieve this, you can create a Departments table and reference it from the Galleries table using a foreign key.
Departments Table:
| DepartmentID | Department Name |
|---|---|
| 1 | The American Wing |
| 2 | European Paintings |
| 3 | The Met Fifth Avenue |
| 4 | Robert Lehman Collection |
Content from NocoDB Introduction
Last updated on 2025-06-26 | Edit this page
Overview
Questions
- What is NocoDB?
- How does NocoDB connect Spreadsheets with a relational database?
- How can i use NocoDB?
Objectives
- Create a new Base and a table within NocoDB
- Add, rename, and configure fields (columns) in a table.
- Choose appropriate data types for different kinds of information.
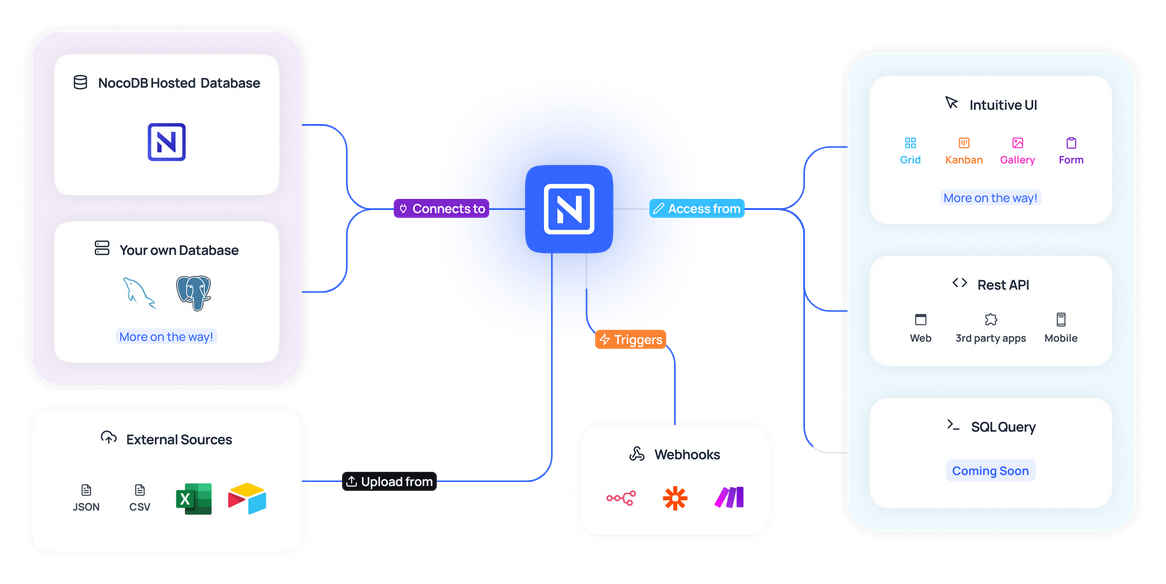
As mentioned earlier, NocoDB is a no-code database platform that combines the ease of use of a spreadsheet with the power of a relational database. In simple terms, NocoDB provides a web-based interface built on top of a traditional relational database like PostgreSQL or MySQL. The great thing about NocoDB is that you don’t need to understand the underlying database technology to use it, one of the key benefits of no-code tools.
With NocoDB, you can create and manage databases through a simple, user-friendly interface, bypassing the need for complex programming. This means that tasks like organizing data, creating tables, and running queries, which would normally require coding, can now be done directly through the web interface. Whether you’re building a database from scratch or working with an existing one, NocoDB makes it easy to interact with your data.
In this tutorial, we’ll focus on using the online version of NocoDB, which you can access here. However, you also have the option to host your own version of NocoDB, either on your local machine or on a server.
Layout
The first step to getting started with NocoDB is to create an account. Once you’ve registered and logged in, you’ll be taken to the NocoDB homepage, where you can begin exploring its features.
On the left side of the interface, you’ll find the main navigation menu, which gives you access to several important options:
- Overview of workspaces and tables
- General settings to manage your NocoDB account
- Team settings for collaborating with others
- Integrations to connect external databases
- The option to create a new Base
In NocoDB, a Base is like a database, it’s a container that holds your tables and provides additional features for organizing and managing your data.
When you first sign up, NocoDB will automatically create a sample Base called Getting Started. This Base opens by default and helps you get familiar with the platform’s core features.
The central area of the screen is where you’ll do most of your work. NocoDB follows a simple structure: at the top level, you create a Workspace, inside this Workspace you have Bases and within a Base, you can add one or more tables. Tables are where your actual data lives, and you can customize them with Views to display and filter your data in different ways. We’ll dive into Views in more detail later.
Creating a Base
Instead of working with the sample Base, let’s create our own so we can explore NocoDB’s features from scratch.
To get started, click on Create Base, give your new
Base a name (e.g., Sample_base), and click
create_base to confirm. You’ve now created an empty
Base, ready to be filled with data.
There are several ways to populate a Base in NocoDB:
- Create a new table manually
- Import data from a file (such as CSV or Excel)
- Connect to an external data source
For this exercise, let’s manually create a new table. Click on
Create New Table, give the table a name (e.g.,
Art_Collection), and you’ll be taken to an empty,
spreadsheet-like interface where you can define the structure of your
table.
At the same time, you’ll notice that your newly created table now appears under your Base in the left-hand menu. This gives you an easy way to navigate between your tables.
If you want to add more tables later on, simply hover over the Base name in the left sidebar, and a plus symbol will appear, click it to add another table.
Data Fields
Now that we’ve created our table, we need to define its structure by adding fields. Fields are the columns of your table. Each one represents a specific kind of information you want to store for every row (or record) in the table. When you first create a table, NocoDB automatically adds a field called Title. This is a default field and cannot be deleted, but you can rename it and choose a different data type to make it fit your needs:
- Locate the Title column in your table.
- Click on the small arrow next to the field name Title.
- From the dropdown menu, select Edit field.
In the dialog box that opens, you can:
- Change the Field Name (for example, rename it to Artwork Title).
- Select a Field Type from the list (e.g., Single line text, Number, etc.).
- Optionally, add a default value for the whole column.
- Optionally, add a Description to explain what this field is for, helpful when collaborating with others.
- Click Save to apply your changes.
Adding a New Field
To add more fields:
- Hover your mouse over the header row in the table, to the right of your existing fields.
- Click on the plus icon (+) that appears.
- In the dialog that opens, enter the Field Name (e.g., Artist).
- Choose the appropriate Field Type.
- Click Create Column to add the field to your table.
You can repeat this process to add as many fields as you need.
Callout: Data Field Types
When creating or editing a field, NocoDB offers a range of data types to choose from. Selecting the right type helps keep your data consistent, makes it easier to sort or filter, and ensures others know what kind of input is expected.
Here are some of the most commonly used field types:
- Single line text: For short text entries like names or titles.
- Long text: For longer descriptions or notes.
- Number: For any numerical values. You can define decimal places and minimum/maximum ranges.
- Date: For calendar dates. You can also include time if needed.
- Single/Multi Select: Lets you define a fixed set of options from which users can choose. Useful for categories like Genre, Location, or Status.
- Checkbox: A simple yes/no or true/false value.
- Email / Phone / URL: Special text types that validate the input (e.g., only valid email addresses can be entered).
- Formula: Calculates values based on other fields, similar to formulas in spreadsheet software.
Exercise: Creating your own table
Now that you’ve learned how to create a Base and add tables and fields, it’s time to apply what you’ve learned.
- Look at the example from the previous episode.
- Create a new, empty table for it, either in your existing Base or in a new one.
- Choose at least 5 informations and create fields using different field types (e.g. Text, Number, Date, Single select, Checkbox). The normal form does not have to be taken into account initially. Simply select the columns you like
- Create one field for an image of the artworks
- Name your fields based on what kind of data you expect (e.g. Title, Author, Year, etc.).
- Try editing a field type or renaming a field.
- Explore freely: test options, click around, and get familiar with the interface.
You don’t need to enter data yet, just focus on setting up the table structure.
Adding a New Relation
Until now we used NocoDB only as a spreadsheet tool. To connect tables with each other, we need the field type Link. This is useful
To add a relation:
- Add a new field by clicking the plus icon (+) in your table header.
- In the dialog, select Links as the Field Type.
- Choose the table you want to link to (for example, linking an Artwork to an Artist).
- Set the relation type (see below).
Callout: Relational Types
- One to One: Each record in Table A can be linked to only one record in Table B, and vice versa. Example: Each artwork has exactly one location, and each location is assigned to only one artwork.
- Has Many (One to Many): Each record in Table A can be linked to multiple records in Table B, but each record in Table B links back to only one record in Table A. Example: One artist can have many artworks, but each artwork has only one artist.
- Many to Many: Records in Table A can be linked to multiple records in Table B, and vice versa. Example: An artwork can be displayed in multiple exhibitions, and each exhibition can include multiple artworks.
- Click Create Column to add the relation field.
Once created, you can select records from the linked table directly within your table. This makes it easy to reference related data without duplicating information and gives you the opportunity to create a relational database.
Relation Types
When creating a link, you have to define how records in your tables relate to each other:
Choosing the correct relation type helps you accurately model your data and ensures that NocoDB enforces the right constraints when linking records.
With the Link field and relation types, you can build complex, interconnected databases in NocoDB—without writing
Content from Working with data
Last updated on 2025-06-26 | Edit this page
Overview
Questions
- How do I import data in NocoDB?
- How do I filter data?
- What kinds of analysis are supported in NocoDB?
Objectives
- import data from csv
- explore foreign data with filter and sort functions
In this episode, we’ll take the first steps toward exploring and analyzing data in NocoDB using two tools: Filters and Sorting. Before we do that, we need to import some data to work with.
Importing a CSV File
We’ll begin by importing a dataset in CSV format. CSV (Comma-Separated Values) is a common file format used to store tabular data. If not already done, please download the data here.
Open the Base where you want to import the data, in our case it can be the Sample_base.
Inside the Base, click on Import Data.
In the dialog that appears, select the CSV option. (NocoDB gives you the oppurtunity to use different file formats and adapt these to a spreadsheet)
-
Choose your CSV file by either:
- Clicking Upload File and selecting the file from your computer, or
- Dragging and dropping the file into the upload area.
- The Field of The Dropdown Menu should be UTF-8, if not, open the dropdown and select it.
Click Import files
Now you can choose which columns you want to import. Leave everything checked and click Import
Your CSV file is now imported into NocoDB and appears as a new table. You should see your data in a spreadsheet-like view, ready to be cleaned and explored.
Adjust Field Types
After importing data, it’s a good idea to review the field types for each column. NocoDB gives the Field Type “Single line text” after importing data, but this can lead to different problems and limitations. Choosing the right field type helps NocoDB understand how to handle your data, and unlocks useful features for filtering, sorting, and analysing.
Exercise: Changing field types
Change the field types of our table according to the data in each column. Which field types but single line text could be useful for the Department or Medium column, where the number of different entries are limited?
Taking time to set this up now will make exploring and further collecting of data much easier.
Filtering Data
Filters allow you to narrow down the data in your table, that you only see rows that match certain conditions. This is especially helpful when working with large datasets or when you want to focus on a specific subset of records. It also gives you the opportunity to get a first impression of the data you have.
To apply a filter:
- Click on the Filter icon (funnel symbol) at the toolbar.
- A filter menu will appear. Here you can create only one filter or a filter group. For the beginning we want to create a single filter. Click on Add filter
- First, you will see a field where you select a column to filter by, an operator to apply and a value to use for the filter. (Different field types will give you different operatos you can choose)
Example:
Filter by Year → greater than →
1950
Filter by Object Name → is equal →
Print
At this point at the latest, it becomes relevant that the correct data types are assigned to the fields, as these enable different operators for filtering. The operators greater than and is equal, for example, are only possible for numerical values.
Grouping Data
Another useful feature for exploring data in NocoDB is Grouping. This allows you to organize your table into logical sections based on the values of a specific field. Grouping helps you quickly spot patterns, compare categories, and get a better overview of how your data is structured.
To group your data:
- In the toolbar at the top, click on the Group icon.
- Choose the field you want to group by, for example:
DepartmentCultureMediumAccession Year
- NocoDB will automatically reorganize the view and display your records grouped by the selected field.
Each group can be Collapsed or expanded to hide or show its rows and to see the related entries. In a next step you can create a subgroup by doing the steps again. With this you can get an even better expression of your data. It also makes it possible to select only a certain part of the data for further analyses and to view partial data sets.
Callout: Field Types and grouping
Grouping works especially well when your field is a Single Select, because the values are already clean and consistent. If you group by a free-text field, make sure the entries are standardized to avoid duplicate or inconsistent group names (e.g., “oil painting” vs. “Oil Painting”).
Sorting Data
Sorting lets you change the order in which records appear, for example, to view the oldest items first or group similar values together.
To sort your data:
- Click on the Sort icon from the toolbar.
- Choose the field to sort by and select:
- Ascending (A–Z or 0–9), or
- Descending (Z–A or 9–0)
- Add multiple sort levels if needed (e.g., by
Yearand then byArtist).
All in all, it can be said that good preparation of the data and selection of the correct field types is essential in order to be able to process the data efficiently in the next step. Well-prepared data enables efficient and targeted filtering, grouping and sorting of the data. All these functions combined make it possible to gain very detailed insights into large, confusing data.
Exercise: Exploring data
Use the Filter, Sort and Group functionality in NocoDB to answer the following questions:
- How many different departments are there and how many works of art are in each department?
- How many works of art were added to the Metropolitan Museum’s collection after 1950?
- Do objects exist that contain one of the tags Women, Battles, Cats or Ships and are attributed to the ObjectName Print?
Content from Views
Last updated on 2025-06-26 | Edit this page
Overview
Questions
- Which views are given?
Objectives
- create a new view
- share a view
In NocoDB, Views are different ways to display and interact with the records in a table. While the underlying data stays the same, each view gives you a unique perspective on that data, optimized for specific tasks like editing, sorting, filtering, collecting input, or tracking progress.
Using views allows you to:
- Customize how information is presented without altering the table’s
structure
- Focus on a specific subset of data using filters and sorting
- Share only selected information with collaborators or the
public
- Collect structured input through web-based forms
Each view type serves a different purpose and supports different workflows. For example, a Grid View is great for editing records directly, while a Form View is useful for collecting new entries from external users. A Gallery View emphasizes visual content, and a Kanban View is ideal for process tracking.
By combining different views, you can adapt the same dataset to a wide range of use cases, from internal team collaboration to public engagement, from raw data entry to polished overviews. All views are created by clicking on the table you want to get a new view of in the left side-bar. There you click on the little arrow, next to the tables name. If already done, you can see all views you created before. If you want to create a new view click Create View. This will open a dropdown where you choose which view type you want to create.
Grid
The first view we want to look at, is the Grid. This view is the standard view in NocoDB you see every time you create a new table. It can be very helpful to create new views for this. Each Grid View can have its own filtering, sorting, and column visibility settings.
Grid Views are also useful for customizing the table display for different audiences. For example, a team working on content might only need to see titles and publication status, while another team handling logistics may require technical fields and internal notes. With multiple views, each team can work efficiently with the same dataset in a way that suits their workflow.
Additionally, views can help maintain focus by hiding irrelevant columns, making it easier to review or edit records. They can also act as templates for repeated processes, such as quality checks, monthly reviews, or report preparation, allowing users to quickly switch between predefined perspectives.
In short, multiple Grid Views offer a powerful way to explore and work with your data from different angles, without cluttering your interface or losing time repeatedly adjusting filters or layouts.
Form
In collaborative settings, it’s often useful to collect data from people who don’t have direct access to your database or who shouldn’t have access to existing data. This is where Form Views in NocoDB come in. They allow you to design a custom form that others can fill out, and their submissions are automatically added as new records to a table of your choice. This also has the advantage that data entry is less vulnerable and fields can be clearly defined and explained.
This is ideal for tasks such as:
- Collecting survey responses
- Enabling structured data entry
- Letting external collaborators contribute without viewing sensitive data or having an account
Creating a Form View
- Look for the table where you want to collect new data, in our case it is the the METObjects table.
- In the left sidebar, open the dropdown with the small arrow, there you cann see all views you created.
- Click “Create View” and then select “Form” from the list of view types.
- Give the form a name (e.g.,
Art_Submissions_Form) to help you identify it later.
You will now see the form editor interface, which displays all fields of your table in a vertical, form-like layout.
Customizing the Form
NocoDB gives you several options to adjust how the form behaves and looks. Most of these customization options are found in the right side-bar:
- Show or hide fields: Use the toggles next to each field to include only the ones relevant for form respondents.
- Reorder fields: Drag and drop fields into a logical sequence to improve usability.
- Appearance Settings: You can change the color or hide the Branding.
- Send Email: It is possible to get an Email notification, if someone filled out the form
More customization can be done, if you click on the fields in the form directly. Here you can:
- Change the field name
- Write explaining text
- Select, if the field is obligatory
- Define conditions for the field
From here you can use the form for yourself to enter new data. This can be helpful if you have to enter complex data and want to minimize the risk of doing mistakes. The other possibility is to share this view, like we did before, to give others the possibility to enter new data.
Sharing the Form
If you click Share at the top right corner and Enable Public Viewig, you will get the link to share your form. Like mentioned before you will get different settings for different views. The two new options you get are the survey-mode, where you will not get the form as a whole directly, but question for question and the option to Enable Pre-fill. All responses submitted through the form are automatically added as new rows in the table the form is linked to. They appear in real time and can be reviewed, edited, filtered, and sorted just like any manually entered record.
Exercise: Creating a form
In this task we want to create a form for adding new data into the table you created in Lesson 3. Create a form-view for this table and use it to submit the data from the lesson or search for new data you want to use in the Met-Collection. Search for a few artworks in the Met-Collection and safe the images on your computer, to submit these with the form aswell.
Gallery
The Gallery View displays each record as a card—ideal for image‑rich or visually oriented datasets. With the new data in our table we can display the artworks in this way. Like before, click Create View and Gallery. Enter a name for the gallery and choose the field with the image.
Creating a Gallery View
-
Open your table.
- Click View dropdown → Create View
→ Gallery.
- Name the view (e.g.,
Art_Thumbnails) and click Create.
Customizing the Gallery
-
Primary image field: Select an Attachment field for
the card thumbnail.
-
Fields on cards: Toggle which fields (title,
artist, year) appear on each card.
-
Layout style: Choose between compact or expanded
card sizes.
- Filter & sort: Apply filters to limit which cards show, and sort order to control their arrangement.
Kanban
The Kanban View turns your data into draggable cards organized by a Single Select field—perfect for tracking status or progress.
Creating a Kanban View
-
Open your table.
- Click View dropdown → Create View
→ Kanban.
- Name the view (e.g.,
Artwork_Workflow) and click Create.
- Select a Single Select field (e.g.,
Status) as the grouping column.
Callout: Kanban
For creating a Kanban View it es obligatory to have a Single-Select-Field. The Kanban board is then sorted according to the categories of the single-select field and can then be moved back and forth using drag and drop.
Calendar View
The Calendar View displays your data as a calendar, ideal for scheduling or date-oriented datasets. With the new data in our table, we can, for example, display the exhibitions and events in this way. Like before, click Create View and Calendar. Enter a name for the calendar and choose the field with the date.
Creating a Calendar View
-
Open your table.
- Click Create View ->
Calendar.
- Name the view (e.g.,
Exhibition_Schedule) and click Create.
Callout: Calendar
For creating a Calendar View, it is recommended to have a Date field. The calendar will then be sorted according to the dates and can be used to schedule events and exhibitions. If there is no Date field you can use the system-field “created at” for the Calendar View, if you want to track when entries were created.
Using the Calendar
-
View events by date: See all events for a specific
date.
-
Drag & drop events: Update the date or time of
an event by dragging it to a new date.
-
Add new events: Create new events directly on the
calendar via a double-blick on one day.
- Filter & sort: Narrow down events by artist, location, or other fields.
Content from Collaborative Work with NocoDB
Last updated on 2025-06-26 | Edit this page
Overview
Questions
- What possibilities are given for collaborative work?
- How can I build a team?
Objectives
- invite members with and without an account
- assign different rights
- create a form for inserting new data
NocoDB is not just a tool for individual work, it is also built to support teams and collaborative projects. Whether you’re managing a shared research dataset, working on a team-based digital humanities project, or simply co-organizing information with colleagues, NocoDB provides powerful, yet easy-to-use features for collaborating directly within the database environment.
In this section, you will learn how to share access to your projects, manage permissions effectively, and create user-friendly forms to collect data from others, even from those who don’t have access to the database itself.
Sharing a Project (Base)
In NocoDB, each project or collection of data is organized in what’s called a Base, similar to a standalone database. When working with others, you can choose to share an entire Base with your team members, collaborators, or external partners.
To begin sharing:
- Go to your main NocoDB dashboard, where all your Bases are listed.
- Click the Base you’d like to share.
- In the top navigation bar click Members
- With the Add Members button, you are now able to invite new members with their email.
- You can invite as much users as you want in one step
- Additional to inviting you need to define a role
- Click Invite to Base to finish the process The role feature is particularly helpful in academic or institutional settings, where access needs to be granted to different people with varying responsibilities and technical backgrounds.
Managing Permissions
Once you’ve shared your Base, it’s essential to control who can do what. NocoDB allows you to assign different roles to each user. These roles determine how much control they have over the data and structure of the Base.
Callout: Roles
There are different roles with different rights in NocoDB:
Owner: The highest permission level. Owners have all admin rights and can also manage access and delete the entire Base. There can be multiple owners, depending on the setup.
Creator: Creator have full administrative rights, they got the same rights like the Owner, without deleting the base.
Editor: Editors can add new records, edit existing entries, and interact with the data itself. However, they cannot change the structure of the table (e.g., adding new fields) or delete the Base. Perfect for data entry or team members updating records.
Commenter: The Commenter cant enter data into the base and can not change anything. He can comment existing records.
Viewer: This role allows users to only view the data. They cannot make any changes, delete records, or add anything new. Ideal for stakeholders who need oversight, but shouldn’t modify anything.
No Access: This role removes a person’s previous rights, which means they no longer have access to the base.
To assign or change a user’s role:
- Go to “Members” for your Base.
- Find the user in the list or add them by email.
- Choose the appropriate role from the dropdown menu next to their name.
Using these roles effectively helps to keep your data safe, your team focused, and your workflow organized.
Sharing Your Base
In some situations, you may want to share the content of a Base with others without giving them the ability to edit or change anything. For example, you might want to publish a dataset so that colleagues, students, or the public can explore the information, but not accidentally modify it.
NocoDB makes this easy by allowing you to generate a read-only shared link for any Base. This creates a live, web-based version of your data that anyone can view without an account. The rights are the same as for the Viewer
To share your Base as a read-only view:
- Navigate to the Base you want to share.
- Click on the “Share” button located in the top-right corner.
- Form here you have the option to Enable Public
Viewing or Enable Public Access
- Public Viewing will share only the specific view of one table you choose. Different Views will give you different options. We will look at these later.
- You can set Custom URL or a Password if you want to control the access
- Public Access shares the whole base with all tables and views
- A link will be generated. You can copy and share this with others.
People who visit the link will see the Base as a web page. They can:
- View all tables and records
- Use filtering and sorting to explore the data
- Switch between views, if multiple exist
- Copy the base into the own environment
However, they cannot:
- Add, edit, or delete any data
- Access settings or structural elements of the Base
This option is a great way to promote transparency, enable lightweight collaboration, or simply allow others to explore and work with your data on their own terms. Also it can be used for the publication of a database.
Exercise: Creating a relational database
Get together in groups and create a new base together. Choose one person as admin, who defines roles and invites everyone. You can also pass on the admin role so that everyone can define roles and invite people once. Now create a relational database in the group with the normalised data from Lesson 2. Select suitable field types and relations.
Content from APIs
Last updated on 2025-06-26 | Edit this page
Overview
Questions
- What advanced options does NocoDB offer?
- What is an API?
- How can I use the API from NocoDB?
Objectives
- explain the basic idea of APIs
- explain the basic idea of a webhook
- use the “Get-Method” through the Swagger-API
NocoDB is not just a user-friendly no-code platform for working with data — it also includes powerful tools for automation and integration. Two of the most important features in this area are APIs and Webhooks. These tools make it possible to create very extensive and complex applications. We will therefore only briefly mention and understand how they work, as using them would require a separate lesson.
APIs
An API (Application Programming Interface) is a standardized way for different software applications to communicate with each other. You can think of it like a digital menu: One system can ask another system for certain data or tell it to perform an action.
In the case of NocoDB, this means that you (or another application) can access your tables from outside the platform, for example, to retrieve data for a website, update records from a form, or automatically insert new entries from another tool.
Why is the NocoDB API such a big deal?
The built-in API turns NocoDB into far more than just a spreadsheet-style tool. With it, you can:
- connect your tables to websites, apps, or reporting
dashboards,
- create automation workflows that respond to updates or
triggers,
- integrate NocoDB into existing IT infrastructure,
- or even develop custom tools that interact with your database in real-time.
This openness and flexibility make NocoDB a powerful backend for both small projects and professional systems. If you use a classic database on your server you need to create the APIs aswell and write code for them. NocoDB creates the APIs automatically for every table and all of your data.
Swagger API
Every base (database) and table in NocoDB comes with its own REST API. This means external systems can read, create, update, and delete records via HTTP — the same protocol that websites use.
Even if you’ve never worked with code before, NocoDB makes it easy to try out these features using a built-in tool called Swagger UI.
What is Swagger?
Swagger (also known as OpenAPI) is a framework for documenting and testing APIs. NocoDB includes a Swagger interface that shows you:
- all available API endpoints (e.g.,
GET /Art_Collection),
- which methods (GET, POST, PUT, DELETE) are supported,
- what data you need to send or receive,
- and what each request will return.
What makes it really useful: you can interact with the API directly in your browser, no setup, no coding required.
Step-by-Step: Exploring the NocoDB API with Swagger
-
Open your base in NocoDB.
- Click the three-dot menu (⋮) next to the base
name.
- Choose “API Docs” — this will open the Swagger
interface.
- You’ll see a list of available endpoints for your base, such as:
-
GET /Art_Collection– get all records
-
POST /Art_Collection– add a new record
-
DELETE /Art_Collection/{id}– delete a specific record
-
📘 This view gives you full documentation and testing access at the same time.
API Code Snippets
NocoDB also helps you generate ready-to-use code snippets for various programming languages. This means you don’t need to write any code yourself, you can just copy and paste. To use these you need an external IDE and know one of the Programming-Languages to use it properly.
How to Copy API Snippets
Open the API Docs for your Base (see above).
Select an API action (e.g.,
POST /{table}to add a new record).Scroll to the bottom of the endpoint description.
Click on the “Code” tab.
-
Choose a language from the dropdown — options include:
- cURL
- Python
- JavaScript (Fetch API)
- Node.js (Axios)
- Shell
-
Copy the generated snippet and try running it in a simple environment like:
- A Python file (
python script.py) - An online code sandbox like Replit or JSFiddle
- Your terminal, for cURL commands
- A Python file (
Webhooks (Intro & Idea)
Webhooks are the reverse of APIs. Instead of you requesting data from NocoDB, NocoDB sends data to you, or to another app, when something happens.
For example you could:
- Notify a Slack channel when a new form is submitted
- Trigger a script when a new record is added
- Send email notifications for updates
How to Create a Webhook
- Open your Base settings.
- Go to the “Automations” section and choose “Webhooks”.
- Click “Create Webhook”.
- Define:
- The event (e.g., “Row Created”)
- The table it should apply to
- The URL that should receive the webhook (you can test this with webhook.site)
- Save the webhook and test it by adding or updating data.
The API and Webhooks are powerful tools that allow you to connect NocoDB to the wider digital ecosystem. You can:
- Automate tasks
- Build integrations with other tools (e.g., Google Sheets, Slack, Notion)
- Add dynamic content to websites or apps
- Create automated workflows based on data changes
Even if you’re not ready to use these tools now, knowing they exist opens the door to new ideas. And with NocoDB’s beginner-friendly interfaces like Swagger and pre-generated code snippets, it’s easier than ever to try them out — no coding background required.