Content from Introduction to OpenRefine
Last updated on 2026-02-24 | Edit this page
Estimated time: 0 minutes
Overview
Questions
- What is OpenRefine and how can it help with messy data?
- What kinds of tasks and analyses can you perform with OpenRefine?
Objectives
- Identify typical problems in cultural heritage datasets
- Describe how OpenRefine supports exploratory data cleaning
Discussion: Do you often work with digital data in your research, your studies or your work?
For example, cleaning it, processing it, converting it or analyzing it? Do you have an idea what problems could arise when working with data, especially external data?
Before you can answer research questions, you first need to understand and clean your data. In the humanities, you might work with lists of artworks, artists, historical events, or other information collected from museums, archives, or fieldwork. Often, this data is stored in spreadsheets or tables, and at first glance, it may seem tidy. But as you look closer, you may notice small issues: names spelled in different ways, missing details, or dates written in various formats. These challenges are common and can make it difficult to analyze or share your data.
OpenRefine is a free, open-source tool designed to help you work with messy data. Think of OpenRefine as a workbench for your data, a place where you can clean, organize, and explore information, even if you have no technical background. OpenRefine runs locally on your computer and opens in your web browser, providing a user-friendly interface that guides you through each step. Working in your web browser might be confusing, but nothing from your dataset is sent to the internet — everything runs locally on your computer.
Our Dataset
Throughout this lesson, you will use a sample dataset from the Metropolitan Museum of Art’s (The Met) Open Access Initiative. The dataset includes artwork titles, creators, production dates, materials, and locations — fields that are typical for cultural heritage collections. Even if you have never worked with data before, you will see how OpenRefine can make your research easier.
In many digital humanities projects, a significant amount of time is spent preparing and cleaning data before analysis. It’s not always the most exciting part, but it is essential. With OpenRefine, you will learn how to think about data organization and develop practices for more effective data cleaning. By the end of this lesson, participants will be able to clean, explore, and analyze structured cultural heritage data. You don’t need to be a technical expert, just curious and willing to try something new.
Challenge: Spot the Messy Data
Look at the small sample below. It contains only a few records from
The Met dataset you will work with later.
Identify anything that might cause problems during analysis.
| Title | Artist Display Name | Object Date | Object Name | City | Tags | Medium |
|---|---|---|---|---|---|---|
| Tile | J. and J. G. Low Art Tile Works | ca. 1884 | Tile | Chelsea | Earthenware | |
| Cabrette | Joseph Bechonnet | 19th century | Cabrette | Effiat, Puy-de-Dôme | Animals | various material |
| “A weaver of dreams” | Margaret Neilson Armstrong; G.P. Putnam & Co., New York; Myrtle Reed | 1911 | New York | |||
| Design for a shawl with scrolling paisley leaves and Indian flowers | Fleury Chavant; Georges Schlatter; J.E.G.; Herault | [after 1844] | Book Print Ornament, Architectur | Paris | Lithograph | |
| Nouveau Cayer de Paysages à l’usage des personnes qui apprennent le Dessin | J. B. Crépy | 1781 | Book | Paris, France | Etching, printed in red |
Questions to discuss:
- What inconsistencies or formatting issues can you spot?
- Which values might make filtering or sorting difficult?
- Are there entries where you would want to investigate further before
analysis?
- Why might these issues matter later in OpenRefine?
- Missing data are sometimes represented by blank cells, N/A or 0.
- Is the title the same as the object name? In some rows they differ in others they are the same.
- The Artist Display Name sometimes contains more people.
- Object dates are often not given as a specific year.
- The cities in the table could be ambiguous, is it Chelsea in the UK or Chelsea in the US? Maybe you can derive a unique location from information about the artist.
- Paris and Paris, France refer to the same place, but are recorded differently..
- Some titles are enclosed in quotation marks, while others are not.
Advantages of OpenRefine
With OpenRefine, you can import your data, discover patterns, fix mistakes, and transform your information so it’s ready for analysis or sharing. You don’t need to know how to code or use complicated software. OpenRefine is built for researchers who want to focus on their work, not on technical details.
One of the strengths of OpenRefine is its ability to help you explore your data and perform simple analysis right from the start. You can quickly filter and sort your data, group similar entries, and visualize distributions to spot trends or outliers. This makes it easy to get a sense of your dataset before diving deeper into research questions. You can also use built-in functions to split or merge columns, remove duplicates, and transform data formats, making your information more consistent and reliable.
OpenRefine supports a wide range of data formats, including CSV, Excel, and JSON, and can connect to online sources and databases. It also allows you to match your data against external databases, such as Wikidata, to enrich your dataset with additional information. Because OpenRefine is open source, it can be extended with add-ons and custom scripts, giving you even more possibilities. The active community around OpenRefine has developed many plugins that add new features, such as connecting to other data sources, exporting to different formats, or automating repetitive tasks.
- OpenRefine is a free, open-source tool for cleaning, organizing, and exploring messy data.
- You can easily import, filter, sort, and analyze your data, even without technical experience.
- OpenRefine supports many data formats and can be extended with add-ons and custom scripts for even more possibilities.
- Using OpenRefine helps you prepare your data for analysis, supporting transparent and reproducible research practices.
Content from Importing Data and Getting to Know the OpenRefine User Interface
Last updated on 2026-02-24 | Edit this page
Estimated time: 15 minutes
Overview
Questions
- How do I start a new project in OpenRefine?
- How do I import a CSV file?
- What options and settings are available during import?
- How is the user interface structured?
Objectives
- Create and configure a new OpenRefine project
- Evaluate import settings using the preview pane and import a CSV file
- Identify the core interface components and explain their functions
Importing Data
In this episode, you will import the Metropolitan Museum dataset used throughout the lesson. To begin, open OpenRefine. When you start OpenRefine, a window in your web browser (at the address http://127.0.0.1:3333/) will open and you are greeted by the start page.
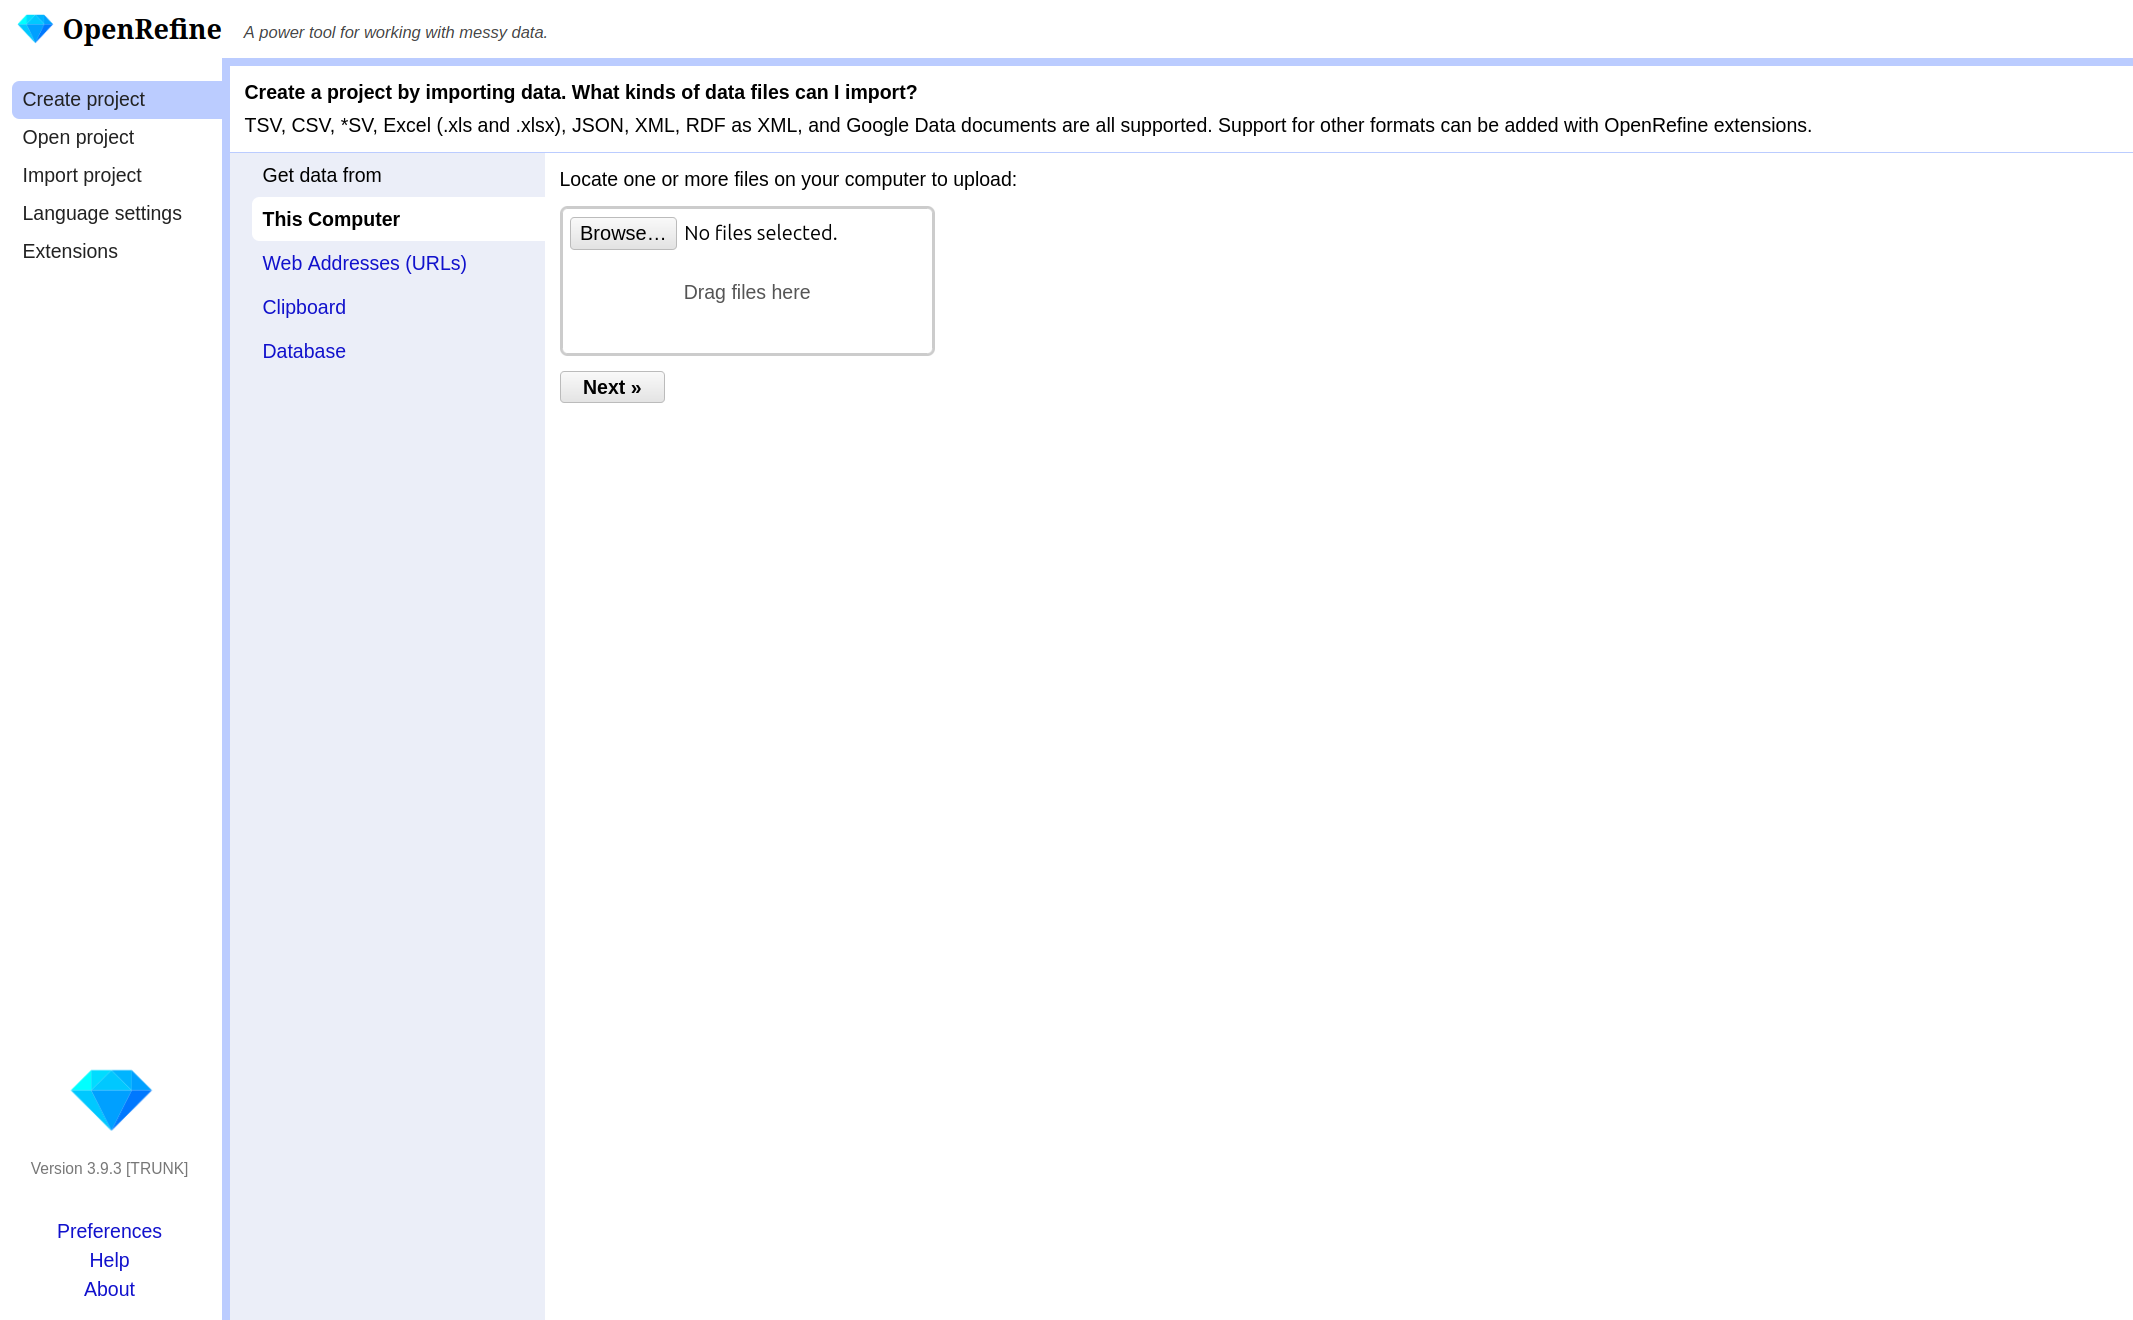
There are various options in the left-hand bar. You can:
- Create a new project and load data.
- Open an existing project.
- Import an existing project.
- Change the language of OpenRefine.
- Manage extensions.
If you have a non-English-speaking audience, you can point out the option to change the language of the user interface. However, this is not advisable for the workshop itself, as the explanations were written for the English user interface and it could otherwise be very confusing for the instructor and the audience.
We will not be looking at extensions in this lesson, but they offer the possibility to customize OpenRefine in even greater detail and expand it with additional functions. Provide the link to the OpenRefine extensions page if participants are interested in additional functionality.
OpenRefine structures your work in projects. To begin
working, you first need to create a new project and import The Met
dataset. If you pause your work on the project (the data and the changes
you made) and want to continue later on, you can choose
Open project. If a colleague sends you an OpenRefine
project, you can import it under Import project.
- Click on
Create Projectand then on Get data fromThis Computer. - Here click on
Browse, locate the datasetmet_dataset_oa.csvon your computer and select it. - Click on
Nextand upload the data into OpenRefine. - On the next page OpenRefine will show you a preview of your data, allowing you to check that everything looks correct before you proceed.
Below the data preview, you find various import settings for how the data should be loaded. These settings have a direct effect on the preview above, allowing us to check immediately whether the settings have been selected correctly. This is especially important when files use non-standard formats, as incorrect settings may result in a distorted table structure.
What kinds of data files can I import?
There are several options for getting your dataset into OpenRefine. You can import files in a variety of formats including:
- Comma-separated values (CSV) or text-separated values (TSV)
- Text files
- JSON (javascript object notation)
- XML (extensible markup language)
- RDF (resource description framework)
- OpenDocument spreadsheet (ODS) or Excel spreadsheet (XLS or XLSX)
If needed, you can change the format on the left side under Parse data as. For more information see the Create a project by importing data page in the OpenRefine manual.
Challenge: Import as Interpretation
Let’s test how sensitive the import process is to incorrect settings. Try changing the separator to a semicolon.
In the import preview, change the column separator from comma to semicolon and observe the preview carefully.
Questions:
- How does the table structure change?
- How many columns are displayed now?
- Why does this happen?
- What would happen if you created the project without correcting this setting?
- The table structure collapses.
- Most or all values appear in a single column.
- This happens because the dataset is comma-separated. When the separator does not match the file structure, OpenRefine cannot divide the data into columns correctly.
- The dataset would be imported incorrectly, making further analysis difficult or impossible.
Sometimes, data files include extra header lines or notes at the top. You can tell OpenRefine to skip these lines, so only the actual data is imported. For Excel files, you can select which sheet to import. For CSVs, you can preview and adjust how columns are interpreted. There are many different options depending on the file format and the dataset. In our case, the default settings are sufficient.
Why import settings matter?
Import settings determine how OpenRefine interprets your file and turns it into a table. If these settings are incorrect, data may be split into the wrong columns, rows may be skipped, or values may be read incorrectly. Correct settings help prevent problems later in your workflow and save time.
- Once you are happy with the preview and settings, you can change
your project name above the preview and click
Create Project. - OpenRefine will load your data into its workspace on the next page.
Overview of the OpenRefine interface
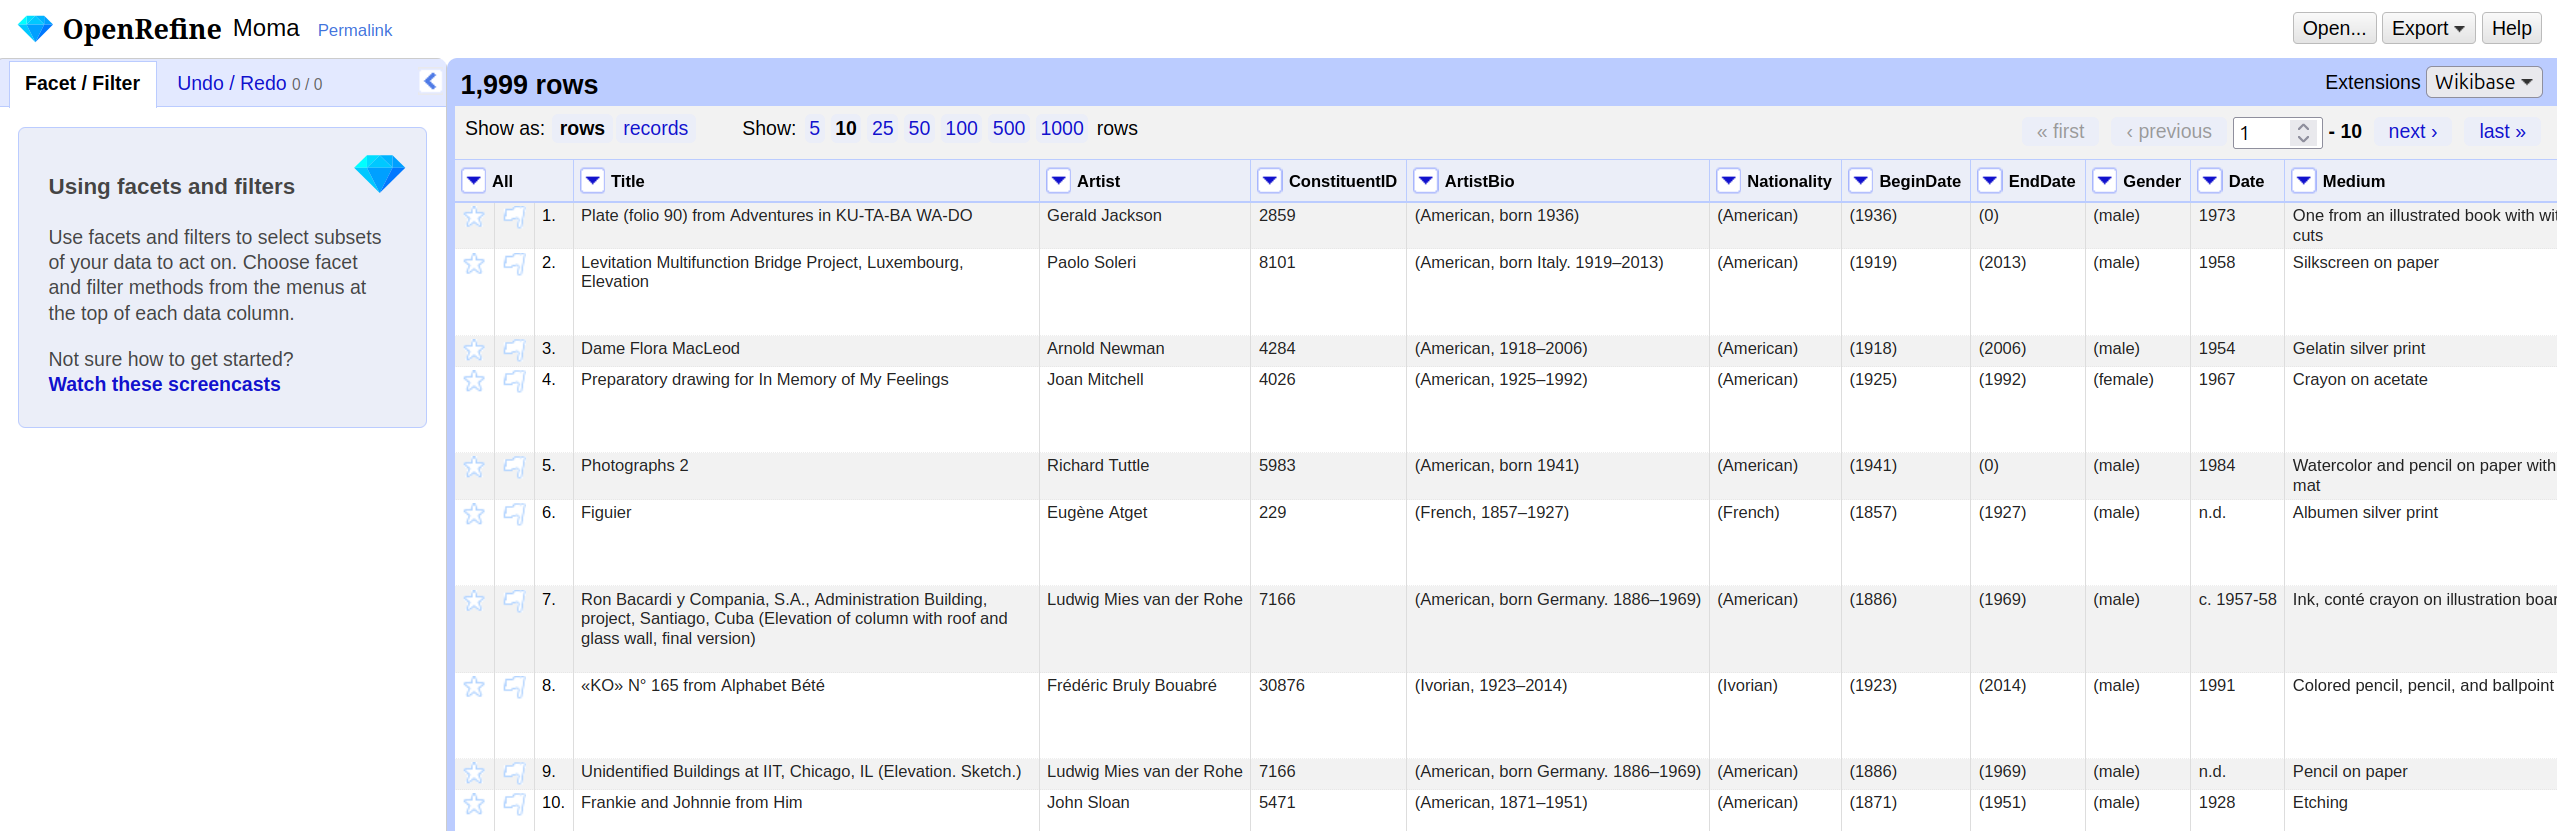
The OpenRefine interface is organized around a central workspace. The main window displays the data in a tabular format called the grid, with rows and columns similar to a spreadsheet: A row represents a record in your dataset, and every column represents a type of information. Above the table in the grid header, you can choose how many rows are shown at once, and you can scroll through the columns within the table.
The row/record distinction will be shown in the next chapter. For now, you can treat one row as one record.
Each column header has a small arrow. Clicking this
arrow opens a drop-down menu with actions that apply only
to that column, such as sorting, faceting, and editing its values: These
are the actions you will learn about in the following chapters
On the left-hand side, the Facet/Filter tab shows all
active filters and facets. These tools allow you to explore the dataset
and to see how your actions affect it. The Undo/Redo tab
records every change you applied to the data. From here, you can step
backward or forward through your changes. Note: All changes are
stored within the OpenRefine project; the original file remains
unchanged. You will use both tabs a lot in the following
chapters.
Lastly, in the right corner of the project bar, the
menu provides access to project-level actions. When you click on
Open..., you return to the start page. The
Help button links to the official OpenRefine documentation.
If you encounter problems in the future, the official documentation is a
useful starting point.
Now that we have successfully imported the dataset and understood the interface, we can begin exploring the data itself.
- OpenRefine organizes your work in projects
- You can import data from different sources and in different formats into OpenRefine
- Adjust import settings to ensure your data is read correctly and preview the results before starting
- The main components of the user interface are the grid, the grid
header, the project bar, and
Facet/Filteras well asUndo/Redotab
Content from Exploring Data
Last updated on 2026-02-24 | Edit this page
Estimated time: 0 minutes
Overview
Questions
- What options does OpenRefine offer for data exploration?
- What is a facet and how does it help me explore data?
- How do facets differ from filters?
- What data types exist in OpenRefine?
Objectives
- Define faceting and identify when to use it.
- Define filtering and identify when to use it.
- Create a text facet to get an overview of values in a column.
- Transform values from one data type to another.
- Use Split multi-valued cells to prepare data for accurate faceting and later analysis.
Facets
When we work with data in OpenRefine, one of the first challenges is to make sense of the information that has been imported. Looking at rows of raw data rarely gives us much insight, especially if the dataset is large. What we need is a way of quickly summarizing values, spotting patterns, and finding potential problems such as inconsistent spellings or unexpected categories.
OpenRefine provides a set of tools for this under the name facets. Faceting allows us to group together all of the different values that appear in a column and to see how often they occur. A facet creates a kind of “interactive summary” of the data: it lists all unique values in a column and shows how many times each one appears.
Text Facet
The most commonly used facet type is called Text
facet. This facet type applies to all string values. Wir werden
gemeinsam unsere erste Text facet erstellen und zwar für die Spalte
Department. Open the column menu with the small arrow next to the column
name and choose Facet → Text facet. A new panel will appear
on the left side of the screen with the unique values inside the column
and the count how often they appear. You can sort the values
alphabetically or by frequency. You can also hover over values to edit
them directly. This simple step immediately transforms a spreadsheet
with hundreds of rows into a clear summary of categories and also helps
to detect first inconsistencies.
The numbers will vary depending on your sample, but the idea is always the same: OpenRefine has grouped all artworks by their department and counted them. You can now click on one department to see only those rows in the table, or select multiple values to combine them by clicking include.
Exercise: First insights to your dataset & correct errors
Create a text facet on the columns: - Is Public
Domain - Object Name -
City.
How many unique values are listed in each column?
What is the most common value and how often does it appear?
Can you spot problems in the Is Public Domain column and can you fix them? :::::::::::::::: solution
::::::::::::::::::::::::::::::::::::::::::::::::
The difference between Facet and Filters
It is useful to distinguish between facets and filters. Both are ways of focusing on a subset of the data, but they work differently. A filter is like a search box: you type in a word or part of a word, and OpenRefine hides all rows that do not match. A facet, by contrast, gives you an overview of all the distinct values in a column and lets you select them interactively.
For example, in the Met dataset, the column Department
might contain categories such as “Architecture & Design,” “Painting
& Sculpture,” or “Drawings & Prints.” A text
facet on this column will immediately show you how many
artworks belong to each department. By clicking on one or several values
in the facet, you can quickly restrict your view to only those artworks,
and then easily switch back to the full dataset.
When you choose Filter → Text filter, a search field
appears on the left side. You can type a term to restrict the dataset to
matching rows.
Exercise: Filter and Editing a subset of data
Rows, Records, and Multi-Valued Cells
Up to this point, we have assumed that every cell in a column
contains only a single value. In real-world data, however, that is often
not the case. In the Met dataset, the Artist Display Name
column sometimes contains two or more names, separated by a
; .
This is problematic for faceting. If we apply a text facet to the
Artist Display Name column as it stands, OpenRefine will
treat the entire string above as one value. The facet will then list
“Pablo Picasso; Georges Braque” as if it were a single artist, which is
clearly not what we want. What we need instead is to treat
Pablo Picasso and Georges Braque as separate
values, each counted individually.
To understand what happens when we correct this, it helps to know about the distinction between Rows and Records in OpenRefine. By default, data is displayed as rows, one after the other. But OpenRefine can also treat a group of rows as belonging to the same record. When we split a cell that contains multiple values, OpenRefine creates additional rows within the same record. That means the number of rows goes up, but the number of records stays the same.
Let us now prepare the Artist column for faceting by
splitting its multi-valued cells.
- First, look through a few rows in the
Artistcolumn and identify whether any cells contain more than one artist. These are usually separated by a comma (,) in the Met dataset. - Switch to Records view (at the top left of the grid, choose “Show as: Records”). This makes it easier to see what happens after the split.
- Open the column menu for
Artist, choose Edit cells → Split multi-valued cells…. Enter the separator,in the box, and click OK. Ignore the other options. - OpenRefine now divides each cell containing multiple artists into separate rows. The total number of rows increases, but the record count stays constant.
- Create a Text facet on
Artistagain. This time you will see the names of individual artists listed separately. Each can now be counted and selected on its own.
Exercise: Split multi-valued cells
It is important to note that OpenRefine only splits the column you
apply the function to. Other columns are left untouched. This means that
if another column also contains multiple values that correspond to those
in Artist, you need to split that column separately, for
example Nationality. Look in the data and split the other
columns if needed.
This small step has a big impact: it ensures that our summaries and analysis represent the data correctly. Instead of hiding two names inside one cell, we now see each artist clearly and can identify patterns such as which artists appear most often in the dataset.
Rejoining Values
Sometimes you may want to put the data back into its original form.
After cleaning or analyzing, OpenRefine allows you to join split rows
back into a single cell. To do this, return to the column menu, select
Edit cells → Join multi-valued cells…, and specify a
separator such as a comma character again (,). This is
useful if you need to export the data in a more compact form later.
Other facet types
Numeric facets are designed for columns that contain numbers, such as dimensions of artworks. They let you interactively explore ranges of values with a histogram and slider.
Let us try this out with the Height (cm) column from the
Met dataset. Open the column menu and choose Facet → Numeric
facet. You might expect to see a histogram, but instead,
OpenRefine shows only a message such as “No numeric values.” This tells
us that the values in the column are not actually recognized as numbers,
even though they look like numbers in the table.
This situation is common when importing data: numbers are often stored as strings (that is, as text), so OpenRefine does not treat them as numeric values. We need to convert them first.
To fix this, open the column menu for Height (cm) again
and choose:
Edit cells → Common transforms → To number.
OpenRefine now attempts to parse each cell in that column as a number. If the value is a valid number, the cell is converted; if not (for example, if the cell is empty or contains text like “unknown”), it becomes a blank cell.
You will see a small change in the formatting of the numbers: they are now right-aligned, which is OpenRefine’s way of indicating that they are numeric rather than text.
With the column properly converted, repeat the earlier step:
Facet → Numeric facet.
This time, OpenRefine shows a histogram with a slider. The histogram groups all the height values into ranges, giving you an overview of how artworks are distributed by size.
By dragging the slider handles, you can focus on particular ranges. For example, you might restrict the view to artworks shorter than 20 cm, or zoom in on those taller than 300 cm. This is especially helpful for spotting unusual values. If you see a very high number, such as “20000 cm,” that might indicate a data entry error.
Numeric facets therefore serve two purposes at once: they help you explore distributions, and they highlight anomalies that need cleaning.
Some columns represent dates, such as DateAcquired or
the year of creation of the artwork. For these, OpenRefine offers the
Timeline facet.
Before you can use a timeline facet, you need to ensure that the column is stored as a date type. You can do this by choosing Edit cells → Common transforms → To date from the column menu. Once converted, you can create a Timeline facet.
The result looks similar to the numeric facet but with dates on the horizontal axis. OpenRefine displays a histogram showing how many rows fall into each time period. You can then drag the slider handles to focus on a specific date range.
For example, a timeline facet on DateAcquired could
reveal when most of the artworks in your sample entered the MoMA
collection. You might see peaks in certain decades, which may correspond
to acquisition campaigns or curatorial trends. By selecting a particular
time range, you can then explore only those artworks acquired during
that period.
Detect blank values
Not every object has information in all columns. Often, the data is
incomplete. Knowing how incomplete the data is can often be important
for planning a later analysis. We can quickly identify the gaps by
selecting Facet → Customised facets → Facet by blank. This
gives us an output with true and false on the left. By selecting false,
we exclude empty data series from the subset. If we do this for all
columns, we only get the data records that are complete.
Exercise: Identify complete records
How many records in the dataset contain information on both
Culture and Tags?
First apply Facet by blank to Culture and
select false. Then apply Facet by blank to
Tags and select false. Only the remaining 175
record contain values in both columns. This are quite few keeping in
mind, that our whole dataset encompass 2076 records.
- Facets provide an interactive overview of the values in a column and help you explore your data.
- Multi-valued cells must be split before accurate faceting is possible.
- Numeric and Timeline facets require converting text values into numbers or dates first.
Content from Custom Facets and GREL
Last updated on 2026-02-24 | Edit this page
Estimated time: 0 minutes
Overview
Questions
- When do we need a custom facet instead of a built-in one?
- How can GREL help us filter or transform data more flexibly?
Objectives
- Understand what a custom facet is and how it differs from standard
facets.
- Learn to write simple GREL expressions for filtering and
transformation.
- Apply a custom facet on the Artist column to distinguish between single and multiple creators.
So far, we have explored facets that you can create by clicking through the menu—text, numeric, and timeline facets. These are powerful, but sometimes our exploration or cleaning task needs a rule that isn’t built in. In those cases, OpenRefine lets us define our own facets using GREL (General Refine Expression Language).
GREL looks like code, but many useful expressions are short and
readable. You can think of them as tiny instructions that tell
OpenRefine how to interpret or transform the value currently in a cell
(that value is referred to as value inside GREL). Every
function we already used could be written in GREL as well, but to make
things easier the most common functions are already built in. The menu,
we are using, simply provides shortcuts for the most common actions.
If, for example, we now want to examine our data set to see which works of art were created by only one or by more than one person, we could create a custom facet to filter by this criteria.
Question: How could we filter the column to find out whether one or more people were involved in creating a work of art??
Look at the column and consider how cells that contain one or more values differ. We can then use GREL to filter based on this difference.
What Is GREL?
GREL stands for General Refine Expression
Language.
It is a small, specialized language used inside OpenRefine to:
- inspect cell values
- transform text and numbers
- check conditions
- extract patterns
- create new values on the fly
Even though GREL looks a bit like programming, most expressions are
short, simple, and intuitive.
You don’t need prior coding experience. GREL is designed to help you
express small, precise rules for working with messy data. Every
transformation available in the menu is ultimately powered by GREL
Creating a Custom Facet with GREL
Open the column menu for
Artist.Choose Facet → Custom text facet…
-
In the dialog, type the following GREL expression:
value.contains(",")This asks, “Does the cell contain a comma?” For each row, OpenRefine evaluates the expression and returns either
trueorfalse. Click OK. In the left panel, you now see a facet with two buckets:
trueandfalse.
This creates a logic-based facet that is not available as a built-in option
Why this works: A Custom Facet runs your expression
on every row, groups the results, and lets you filter by the outcome.
You can write tests that return booleans
(true/false), strings (e.g., normalized
categories), or even numbers—OpenRefine will facet whatever the
expression returns.
Example: Detecting Unusually Long Titles
Another common task during data exploration is to identify values that might need attention based on their length. Very long artwork titles may indicate:
- combined fields
- metadata copied incorrectly
- multiple titles in one cell
- comments included inside the field
We can create a custom facet to group titles into “short” and “long” categories.
Open the column menu for
TitleChoose Facet → Custom text facet…
-
Enter this GREL expression:
if(value.length() > 40, "long title", "short title")
This expression checks the length of each title: - If the title has
more than 40 characters → "long title"
- Otherwise → "short title"
OpenRefine will show two groups: - long title
- short title
This allows you to quickly check whether unexpectedly long titles need to be cleaned, split, or reviewed.
You can adjust the number (40) depending on what makes sense for your dataset.
In this example, we use a more complex GREL expression:
if(value.length() > 40, "long title", "short title")Compared to the earlier expression
(value.contains(",")), this one does more than simply check
the cell’s content and return true or false.
Here, the expression not only inspects the value but
also creates a new category based on a condition.
This expression works in two steps:
Inspect the cell:
value.length()calculates how many characters the title contains.-
Produce a new output:
Theif()function checks whether the condition is true (value.length() > 40).- If true → it returns
"long title".
- If false → it returns
"short title".
- If true → it returns
What’s important is that these two labels do not
exist in the dataset.
They are created entirely by the GREL expression, and
OpenRefine then groups rows based on these newly generated values.
This shows a key idea of custom facets:
Custom facets do not have to group by the original cell contents; they can group by computed values that you define using GREL.
That is why the expression in this example includes more than just
value. We are not only checking the cell, but actively
creating a classification that helps us explore the data.
Callout: GREL-Functions
-
value.toLowercase()– lowercase the text. -
value.toUppercase()– uppercase the text. -
value.trim()– remove spaces at start/end. -
value.length()– number of characters. -
value.contains("text")–trueif “text” occurs. -
value.startsWith("A"),value.endsWith(".")– prefix/suffix checks. -
value.replace("old","new")– literal replace. -
value.replace(/\s+/," ")– regex replace (collapse multiple spaces). -
value.split(";")– split into an array on;. -
array.join("|")– join array back to a string. -
value.toNumber()– parse numbers (non-numeric becomes blank). -
value.toString()– convert back to text. -
isBlank(value)–truefor empty/whitespace-only. -
isNull(value)–truefor null values (missing). -
type(value)– returns “string”, “number”, “date”, etc. -
value.toDate()– parse a date (from strings like1954-05-01). -
value.toDate().toString("yyyy")– format the date to year. -
now()– current date/time (useful for comparisons).
- Custom facets group data using computed results
from a GREL expression, not only the original cell values.
- GREL is a lightweight language that allows you to inspect,
transform, and classify data inside OpenRefine.
- Custom facets let you ask flexible questions about your data, such
as identifying multiple creators or unusually long titles.
- With conditional expressions like
if(), you can define new categories that support deeper exploration and data-quality checks.
Content from Transforming Data
Last updated on 2025-11-18 | Edit this page
Estimated time: 0 minutes
Overview
Questions
- How can we clean and standardize the ArtistBio values in OpenRefine?
- What is the difference between finding issues (facets) and fixing them (transformations & clustering)?
Objectives
- Remove literal characters with GREL replacements.
- Split ArtistBio into nationality and life-dates.
- Inspect and normalize a column.
Facets help us find patterns; transformations and clustering
help us fix them consistently.
In the MoMA sample, the column ArtistBio stores
nationality plus life information in a compact string. Typical examples
look like:
(American, born 1936)
(American, born Italy. 1919–2013)
(American, born Germany. 1886–1969)
(French, 1857–1927)
(Ivorian, 1923–2014)
This is a fairly typical situation in cultural data: multiple pieces of information are packed into a single field, sometimes with inconsistent separators or formatting.
As mentioned before, some rows contain information about multiple artists, so we must ensure the rows are split correctly before working with this column.
Discussion: By which separator can we split the ArtistBio column?
It may happen that different data items are not separated by a comma or a semicolon, in which case creativity is required to determine how to resolve these data items.
You can separate the data at the string ) (.
Next, we will simplify the text, then split nationality from the remaining details, and finally use clustering to review and standardize the results.
Transformation with GREL
We start with a literal replacement to remove parentheses. This is a very common first step in cleaning, because parentheses, brackets, or punctuation often only serve visual use, not analytical use.
- Open the column menu for ArtistBio.
- Choose Edit cells → Transform….
- Enter:
value.replace("(", "").replace(")", "")- Click OK.
What this does
The expression consists of two chained replace() calls.
Each replace(old, new) looks for a specific character or
substring and replaces it with something else. Because the second
argument is an empty string, the character is completely removed.
OpenRefine processes the expression for each cell:
-
(becomes nothing
-
)becomes nothing
- everything else stays as-is
This kind of literal replacement is safe because parentheses are not meaningful content—they only frame the information.
After this step, values change from:
(American, born 1936)to:
American, born 1936Add a quick Text facet on ArtistBio to confirm that parentheses are gone.
Edit Columns
So far, we have transformed the content of a cell. But sometimes the data is best cleaned by restructuring it, splitting one column into multiple columns.
The current pattern is:
<Nationality>, <rest>To isolate the nationality, we split at the comma. This is good practice: each column ideally contains one type of information (a principle often called “tidy data”).
- Open the column menu: ArtistBio → Edit column → Split into several columns…
- Separator:
, - Split into: leave the default
- Confirm with OK
Afterward you get:
- ArtistBio 1 → nationality (“American”, “French”, “Ivorian”, …)
- ArtistBio 2 → biographical details (“born 1936”, “1857–1927”, …)
If a cell contains more than one comma, OpenRefine will generate more columns (ArtistBio 3, ArtistBio 4, …). This shows how splitting is both powerful and potentially revealing—sometimes extra commas indicate noise or irregular formatting.
Clustering
Even after splitting, the remaining biographical information still varies greatly:
born 1936born Italy. 1919–20131857–19271923–2014- variations in punctuation and spacing
- different types of dash characters
These inconsistencies make it hard to analyze the data reliably.
Clustering is one of OpenRefine’s most powerful tools for identifying and normalizing such variations—especially when the inconsistencies appear similar but not identical.
What is clustering?
Clustering is OpenRefine’s way of grouping together text values that
look or sound similar.
It does this by reducing each value to a “key” based on
a transformation.
For example:
You might remove vowels and make everything uppercase:
“Color” → “CLR”, “Colour” → “CLR” → matchOr you might use phonetic rules:
“Smith” → “SM0”, “Smyth” → “SM0” → match
A “keying function” transforms two strings that should be the same into the same key, even if their spellings differ slightly. There are many more clustering methods, all of which can recognise different patterns. It helps to understand these in order to find the right method, but often it is enough to try them out and proceed step by step.
OpenRefine uses this idea to suggest groups of values you may want to merge.
How to use it here
- Open: ArtistBio 2 → Edit cells → Cluster and edit…
- Method: Key collision
- Keying function: Metaphone 3
More detailed explanation
- Key collision compares transformed keys. If two values produce the same key, they fall into the same cluster.
-
Metaphone 3 is a phonetic algorithm—it groups text
based on how it sounds rather than how it is spelled. This is useful for
cases like:
born Germany. 1886–1969born Germany 1886-1969
→ punctuation differs, but the core phrase is the same.
For numeric ranges (like dates), clustering won’t combine values with
different numbers—e.g., 1857–1927 and
1923–2014 remain separate.
But clustering will show you repeated structures, such as:
- “born Italy”
- “born Germany”
- “born 19XX”
This helps you spot repeated phrases and standardize them if needed.
What you’ll see
The clustering window shows one line per suggested cluster:
- On the left: variations of a similar value
- On the right: a field where you choose the unified form
You can then decide:
-
Merge and reformat them into a consistent
style
-
Ignore clusters if the variations are
meaningful
- Edit only some entries
Clustering never changes anything automatically. You are in control—OpenRefine simply helps you notice patterns you would otherwise miss.
This makes clustering extremely effective for cleaning humanities datasets, where controlled vocabulary is uncommon and metadata comes from diverse sources.
- Transformations modify the content of cells, while column operations reshape the structure of the dataset.
- Literal GREL replacements help remove unwanted characters and prepare text for further processing.
- Splitting columns separates different types of information, making the data easier to analyze and clean.
- Clustering identifies similar but inconsistently written values and supports manual standardization.
Content from Reconciling Data with External Data Sources
Last updated on 2025-11-11 | Edit this page
Estimated time: 35 minutes
Overview
Questions
- What does it mean to reconcile data?
- Why is reconciliation useful in humanities research?
- How can we use OpenRefine to enrich our dataset with identifiers and structured information?
Objectives
- Understand the concept of data reconciliation.
- Reconcile names and places.
- Add stable identifiers (IDs).
So far, we have used OpenRefine to look at and clean our dataset: splitting columns, removing unwanted characters, and clustering values. These steps improve the quality of our data, but our values are still just strings, plain text without a deeper connection to knowledge outside our file.
Reconciliation is the process of linking these
strings to stable, external identifiers in authority
databases such as Wikidata, the Getty
vocabularies, or other domain-specific repositories. Instead of
simply having the text Pablo Picasso, reconciliation can
connect our cell to the unique Wikidata item Q5593. This
turns our dataset into something that can be connected and compared with
other datasets and research around the world.
You can think of reconciliation as asking a librarian: “I have this name written here – which exact person in your catalog does it refer to?” The librarian might return a short stack of cards with possible matches, and you confirm the right one. Once linked, the reference is unambiguous and stable.
In humanities datasets, names and places are central. But names are often ambiguous:
-
Variant spellings:
Shakespeare,Shakespear,Shakspeare -
Common names:
John Smith -
Different languages:
Munichvs.München
If we keep these as plain text, any comparison across collections or projects becomes unreliable. But if we reconcile to shared identifiers (like Wikidata QIDs), we can:
- Connect our dataset to others, regardless of spelling differences.
- Enrich our data with structured information (e.g., dates of birth, countries, occupations).
- Support reproducible analysis by referring to stable, citable identifiers rather than local labels.
Reconciliation therefore transforms a local, isolated dataset into part of a larger knowledge graph.
Reconciling with OpenRefine
OpenRefine makes reconciliation simple and interactive:
- It provides built-in or addable reconciliation services (such as Wikidata).
- It lets you review and confirm matches cell by cell, or accept high-confidence matches in bulk.
- It allows you to pull in identifiers, labels, and even additional properties as new columns.
This combination of automation and human oversight is powerful: the machine proposes matches, but the researcher remains in control of what is accepted.
We will reconcile two columns in our dataset:
-
Artist– the name of the artist. -
Nationality– the country information we previously separated from the biography.
Reconciling the Artist column
- Open the menu on
Artist→ Reconcile → Start reconciling… - Select Wikidata as the reconciliation service. If
it does not appear, add it via Add Standard Service… and paste
the URL:
https://wikidata.reconci.link/en/api. - In the type field, type and select Human (Q5). This tells Wikidata we are looking specifically for people.
- Click Start reconciling.
OpenRefine now sends each name in the column to Wikidata and retrieves possible matches.
Reviewing the matches
If the assignment is clear the reconciliation is complete. However, it is often the case that it is not clear and requires manual checking. If there are several candidates to choose from and OpenRefine is unsure which one is correct, all options are displayed in the respective cell. Hovering over one of the names will display some information to help you decide which person is correct. You can also go directly to the entire database page to obtain even more information. Once you have found the correct person, you can either reconcile all cells with this name or just this one.
This is like being handed several possible business cards for the same name. Your task is to select the one that fits the person in your dataset.
Use birth/death dates and occupations in the description to disambiguate common names.
Adding identifiers
The links now looks very good and can already be used in OpenRefine. However, if we export the file, the reconciliation disappears again, as in its current state it only works in OpenRefine itself. We therefore need to add another column with the assigned ID so that it can also be used outside of OpenRefine. We do this as follows:
- Column menu →
Artist→ Reconcile → Add entry identifiers column. - Give it a name, for example Artist_ID.
- Click OK.
Now, every artist is linked to a stable identifier.
Reconciling the Nationality column (countries)
Now we can reconcile these values as well:
- Column menu →
Nationality→ Reconcile → Start reconciling… - Choose Wikidata.
- Set the type to Country (Q6256).
- Start reconciliation.
This ensures that different spellings or forms like USA,
United States, and United States of America
all link to the same stable identifier: United States of America
(Q30).
- Reconciliation links text strings to unique identifiers in external databases.
- This makes your dataset more precise, reusable, and comparable across projects.
- OpenRefine provides a structured workflow for reconciliation: propose → review → confirm → enrich.
- The human researcher stays in control: machines suggest, but you decide.
Content from Undo, Redo, and Exporting Workflows
Last updated on 2026-02-02 | Edit this page
Estimated time: 10 minutes
Overview
Questions
- How can we go back to an earlier step if we realize we made a
mistake?
- How can we save our cleaning process to repeat it later or share it with colleagues?
- How can we export the cleaned data.
Objectives
- Use the Undo/Redo tab to reverse mistakes.
- Export and Import workflows.
- Understand the value of transparency and reproducibility in data cleaning.
- Export data in different formats.
Undo/Redo
On the left-hand side of the OpenRefine interface, you will find the
Undo/Redo tab. This tab lists every action you have taken
since the project was created. Each action has a short label, such as
“Text transform on 2000 cells… or “Split multi-valued cells
in column nationality”.
- Click on the
Undo/Redotab in the left sidebar.
- You will see a list of all your steps in order. The most recent one
is at the bottom.
- By selecting an earlier step in the list, you can roll the dataset back to exactly how it looked at that moment.
This is like having a time machine for your dataset: you can test transformations freely without the fear of making permanent mistakes. And if you change your mind, you can always jump back to any earlier state. When cleaning messy data, we rarely get everything right on the first try.
Example: After splitting the ArtistBio column into multiple parts, you might notice that the country information was separated cleanly, but the century data became fragmented and less useful. Using Undo/Redo, you can jump back to the step before the split and try a different approach.
Exporting and Importing Workflows
Undo/Redo does more than let you move backwards. It also keeps track of your entire cleaning process as a set of instructions. OpenRefine can export these instructions as a JSON file. This file does not contain the cleaned data itself, but only the cleaning steps wich were applied to the data.
- Go to the
Undo/Redotab.
- Click on the button
Extract....
- A dialog will open showing all the processing steps in JSON on the
right side. You can select which steps to include into the JSON by
selecting the checkboxes on the left side.
- Save the processing steps to a JSON file by clicking
Exportor copy it manually to your clipbord and paste it into a file on your computer.
Later, you or someone else can import this workflow into another OpenRefine project:
- In the
Undo/Redotab of the other project, clickApply....
- Paste the JSON code directly or upload the JSON file.
- OpenRefine will replay the exact same steps on the new dataset.
This feature is especially powerful in research, where transparency and reproducibility are essential. Instead of describing vaguely what was done, we can share the precise workflow that produced our dataset. Other researchers can review it, replicate it, or adapt it to their own data.
Workflows as Reusable Recipes
Think of Undo/Redo export files as recipes. Just like a recipe tells you how to combine ingredients to bake a cake, an OpenRefine workflow tells you how to transform raw data into a cleaned dataset. If you don’t like the taste, you can always tweak the recipe.
Exporting data
The cleaned dataset can be exported in different formats like
tsv, csv, html depending on your
further planned work with the data. You find these options under
Export on the right side of the project bar. Here you also
have the option to export the entire OpenRefine project (data and
processing history) for sharing it with colleagues or as a project
backup. In this case you select
OpenRefine project to archive file and an archive file
(.tar.gz) will be downloaded to your computer.
Exporting pitfall
Ensure that no filters are active so that the entire dataset is exported. You can check this by looking at the information above the table, for example, “10 matching rows (1999 in total)”. In this case, only the subset of 10 data rows will be exported. Filters are easy to forget, especially when you have been exploring subsets of the data.
- OpenRefine records every transformation you make.
- The Undo/Redo tab lets you move backward and
forward through your cleaning process.
- Workflows can be exported as JSON and reapplied to other projects, ensuring transparency and reproducibility.
Content from Resources for Future Self-study
Last updated on 2025-11-11 | Edit this page
Estimated time: 0 minutes
Overview
Questions
- TODO
Objectives
- TODO